
Release-Date
Reference-Number
2025-190
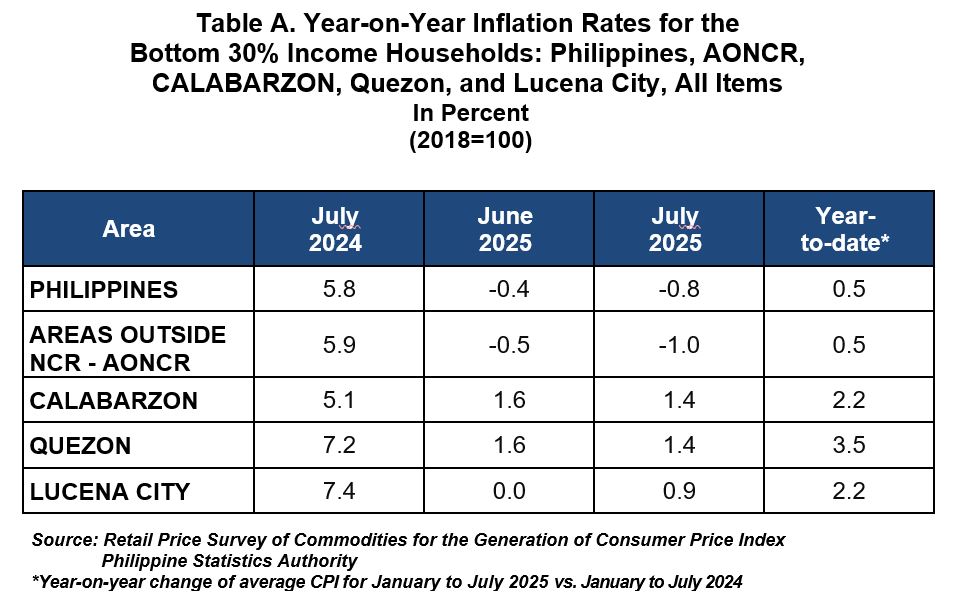
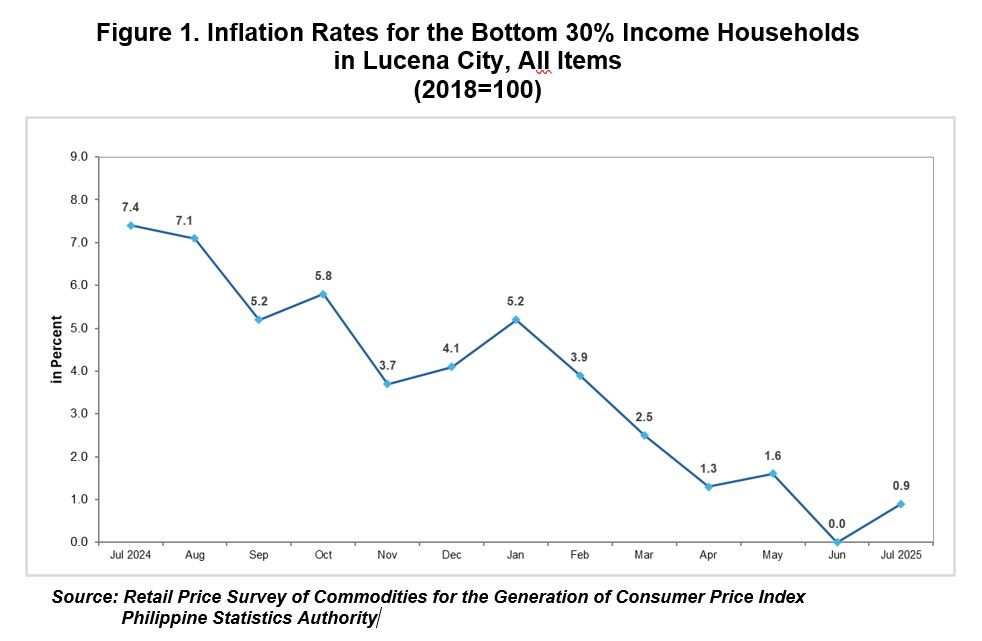
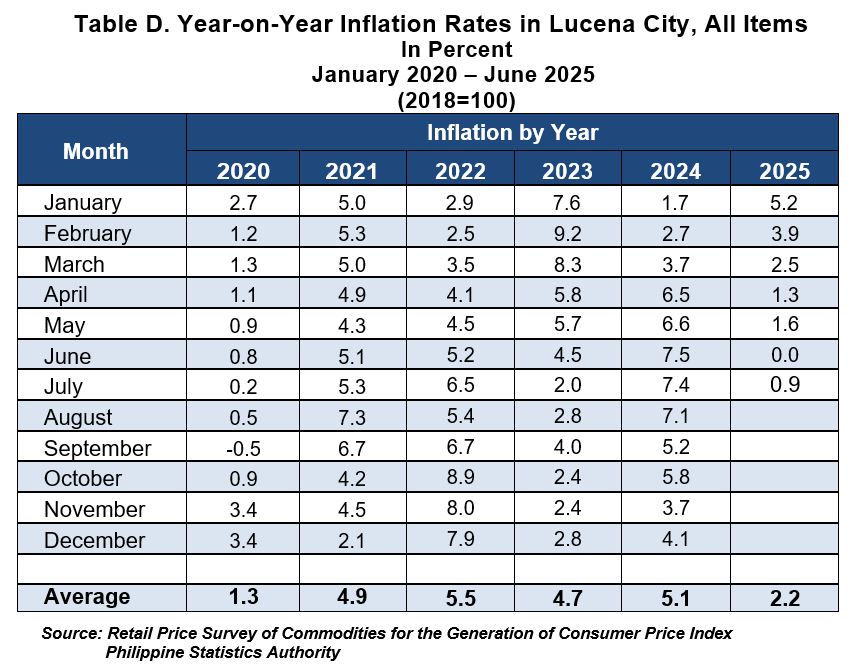
The inflation rate for the bottom 30% income households in Lucena City was recorded at 0.9 percent in July 2025 from 0.0 percent in June 2025. This brings the average inflation rate for this income group from January to July 2025 to 2.2 percent. In July 2024, the inflation rate was higher at 7.4 percent.
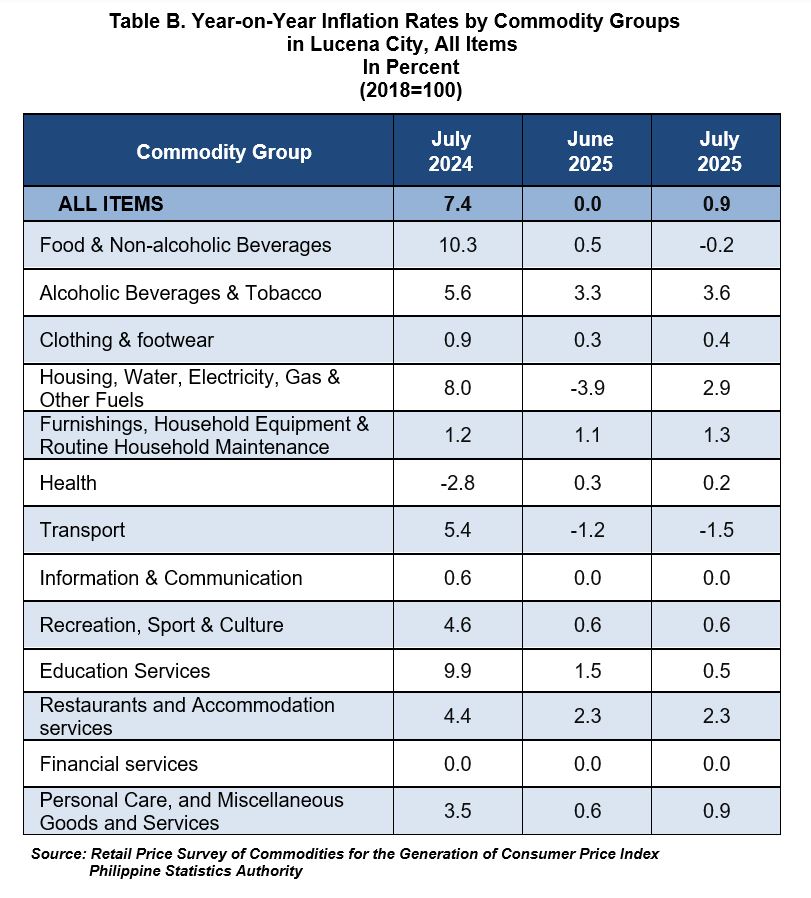
The main driver to the uptrend in July 2025 was the higher year-on-year growth rate in the index of housing, water, electricity, gas and other fuels which increased to 2.9 percent from -3.9 percent in the previous month.
Also contributing to the uptrend were the higher annual increments in the indices of the following commodity groups:
a. Alcoholic beverages and tobacco at 3.6 percent, from 3.3 percent;
b. Clothing and footwear at 0.4 percent, from 0.3 percent;
c. Furnishings, household equipment and routine household maintenance at 1.3 percent, from 1.1 percent; and
d. Personal care, and miscellaneous goods and services at 0.9 percent, from 0.6 percent.
In contrast, lower annual rates were observed in the indices of the following commodity groups during the month:
a. Food and non-alcoholic beverages at -0.2 percent, from 0.5 percent;
b. Health at 0.2 percent, from 0.3 percent;
c. Transport at -1.5 percent, from -1.2 percent; and
d. Education services at 0.5 percent, from 1.5 percent.
Meanwhile, the following commodity groups retained their previous month’s rates:
a. Information and communication at 0.0 percent;
b. Recreation, sport and culture at 0.6 percent;
c. Restaurants and accommodation services at 2.3 percent; and
d. Financial services at 0.0 percent.
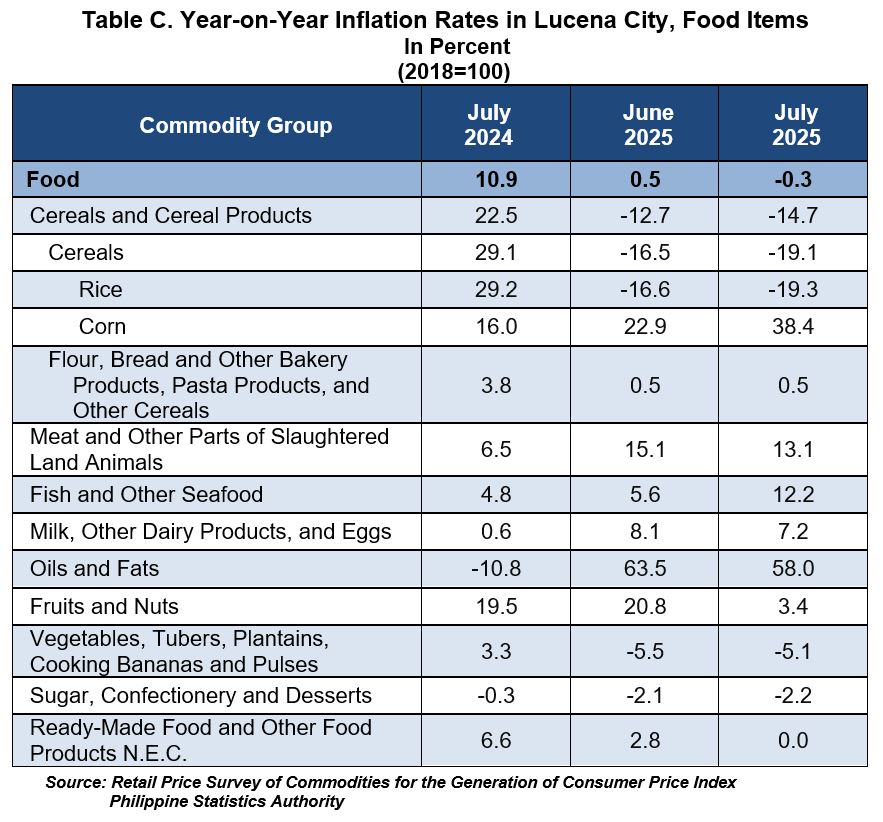
Food inflation for the bottom 30% income households in Lucena City eased to -0.3 percent in July 2025 from 0.5 percent in June 2025. In July 2024, food inflation was higher at 10.9 percent.
The slowdown in food inflation was primarily attributed to the lower annual increment in the index of rice, which declined to -19.3 percent during the month from -16.6 percent in the previous month.
Also contributing to the downtrend were the lower annual growth rates in the indices of the following food groups:
a. Meat and other parts of slaughtered land animals at 13.1 percent, from 15.1 percent;
b. Milk, other dairy products and eggs at 7.2 percent, from 8.1 percent;
c. Oils and fats at 58.0 percent, from 63.5 percent;
d. Fruits and nuts at 3.4 percent, from 20.8 percent;
e. Sugar, confectionery and desserts at -2.2 percent, from -2.1 percent; and
f. Ready-made food and other food products not elsewhere classified at 0.0 percent, from 2.8 percent.
In contrast, the following food groups recorded higher annual increments during the month:
a. Corn at 38.4 percent, from 22.9 percent;
b. Fish and other seafood at 12.2 percent, from 5.6 percent; and
c. Vegetables, tubers, plantains, cooking bananas and pulses at -5.1 percent, from -5.5 percent.
Meanwhile, the index of flour, bread and other bakery products, pasta products, and other cereals retained its previous month’s annual rate of 0.5 percent.
(SGD.) AIRENE A. PUCYUTAN
Provincial Statistics Officer
PSA Quezon
NDP/SCNG
| Attachment | Size |
|---|---|
|
|
2.64 MB |