
Release-Date
Reference-Number
2025-031
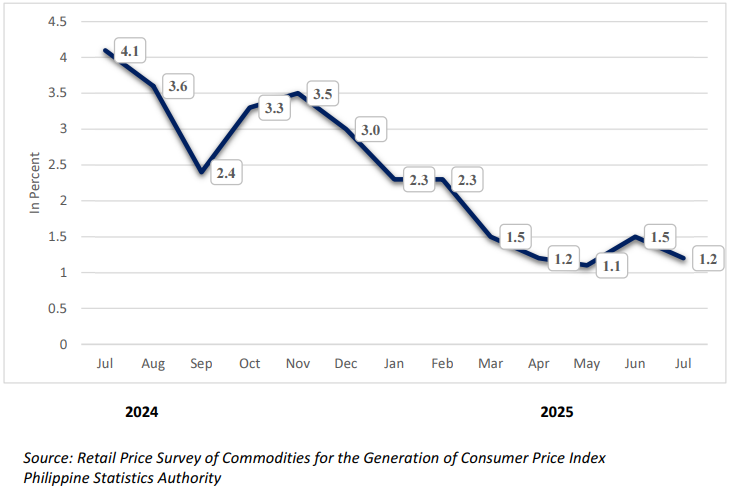
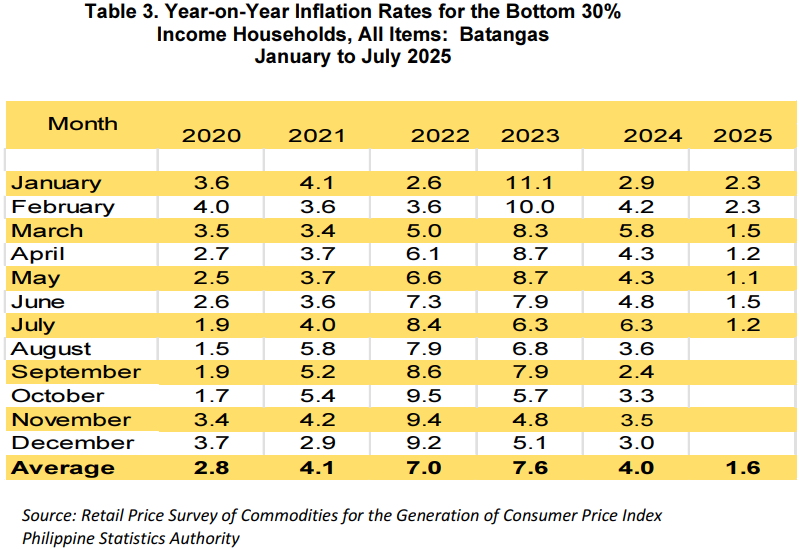
The Batangas Province inflation rate for the bottom 30% income households decelerated further to 1.2 percent in July 2025, from 1.5 in June 2025. This brings the average inflation rate for this income group from January to July 2025 to 1.6 percent. In comparison, the inflation rate in July 2024 was recorded at 4.1 percent (Figure 1).
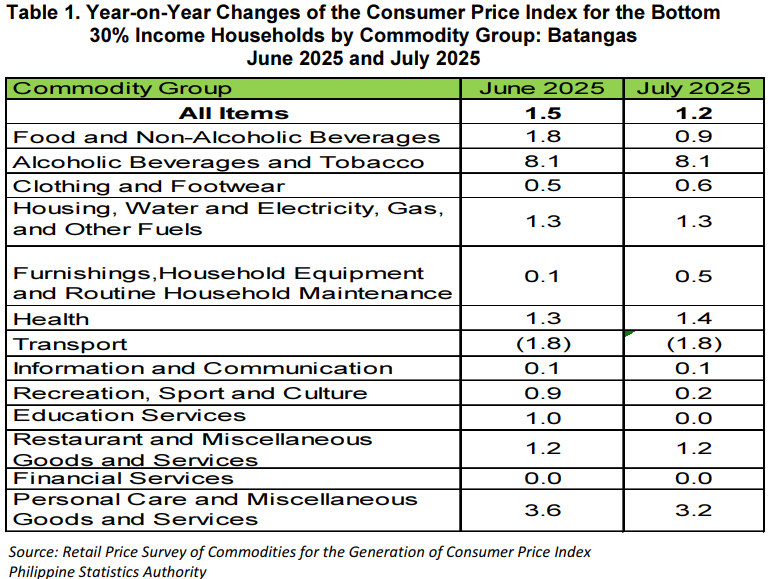
The downtrend in the overall inflation for the bottom 30% income households in July 2025 was primarily driven by the annual decrease in the index of the food and non-alcoholic beverages, which lower to 0.9 from 1.8 percent in June 2025. It was followed by Personal care, and miscellaneous goods and services at 3.2 percent in June 2025 compared to 3.6 percent in the previous month. Recreation, sport and culture, and Education services also contributed to the lower inflation rate, as its indices posted a slower annual decline of 0.2 percent and 0.0 during the month from 0.9 percent and 1.0 percent in the previous month, respectively.
In addition, higher annual growth rates were noted in the indices of the following commodity groups in July 2025:
a. Clothing and footwear, 0.6 percent from 0.5 percent
b. Furnishings, household equipment and routine household maintenance, 0.5 percent from 0.1 percent
c. Health, 1.4 percent from 1.3 percent
In contrast, the remaining commodity groups retained the inflation rates during the month.
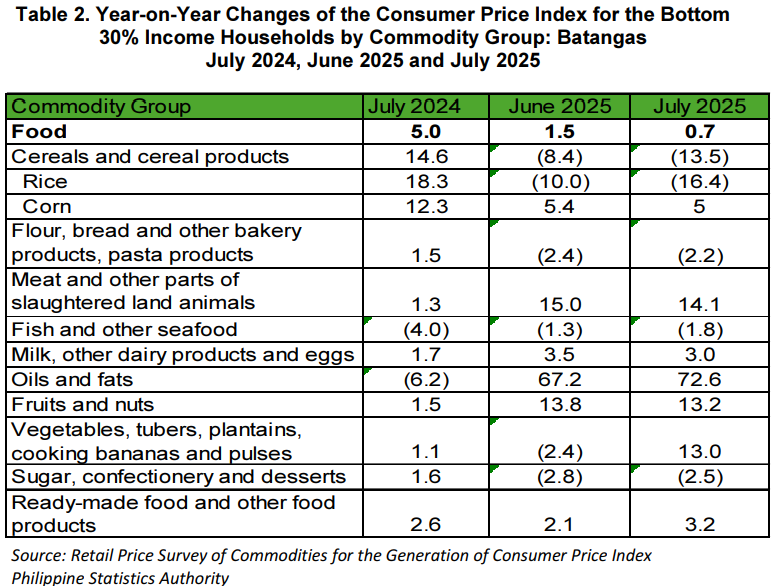
Food inflation for the bottom 30% income households in Batangas recorded an annual decrease of 0.7 percent in July 2025 from 1.5 percent in the previous month. In July 2024, food inflation was recorded at 5.0 percent.
The decrease of food inflation in July 2025 was primarily driven by the faster year-on-year decreases in the following food groups:
a. Meat and other parts of slaughtered land animals, 14.1 percent from 15.0 percent
b. Oils and Fats, 72.6 percent from 67.2 percent
Vegetables, tubers, plantains, cooking bananas and pulses, 13.0 percent from (2.4) percent
Fruits and nuts, 13.2 percent from 13.8 percent
Milk and other parts of slaughtered land animals, 3.0 percent from 3.5 percent
On the contrary, faster year-on-year increases were observed in the indices of:
Flour, bread and other bakery products, pasta products, (2.2) percent from (2.4) percent
Sugar, confectionery and desserts, (2.5) percent from (2.8) percent
Ready-made food and other food products, 3.2 percent from 2.1 percent
In addition, the corn inflation rate slowed further to 5.0 percent in July 2025 from 5.4 percent in the previous month.
The top three food groups in terms of contribution to food inflation during the month were as follows:
a. Meat and other parts of slaughtered land animals with a 398.8 percent share or 2.79 percentage points
b. Oils and fats with a 269.5 percent share or 1.89 percentage points; and
c. Vegetables, tubers, plantains, cooking bananas and pulses with a 133.2 percent share or 0.93 percentage points

| Attachment | Size |
|---|---|
|
|
269.45 KB |