
Release-Date
Reference-Number
2025-005
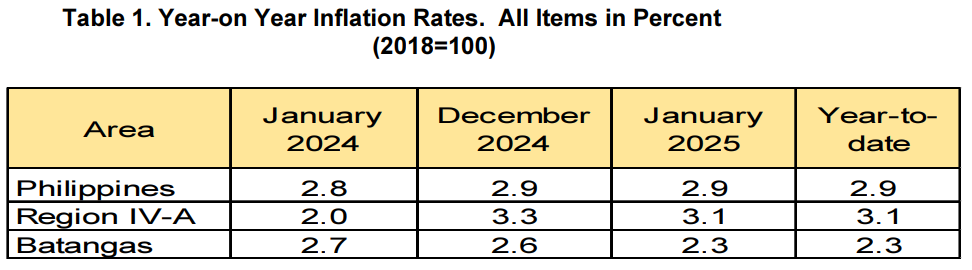
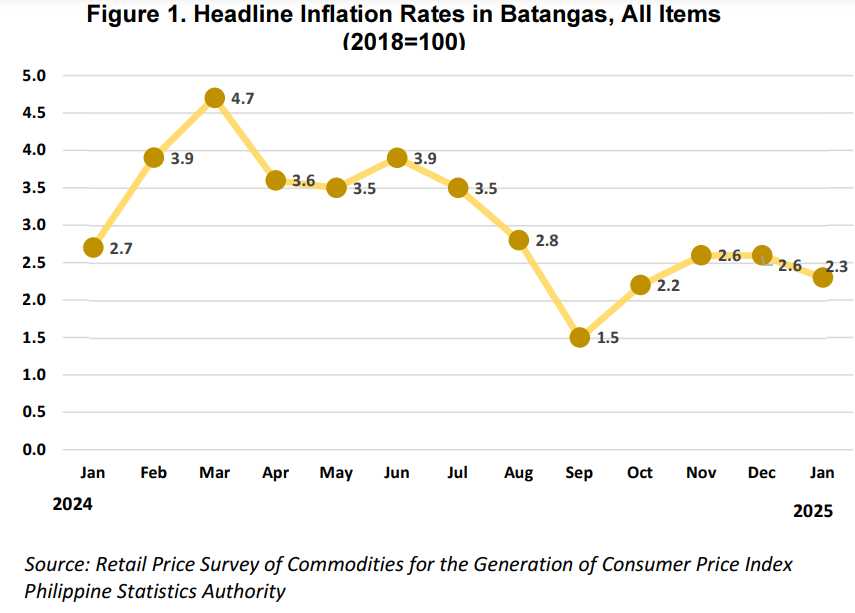
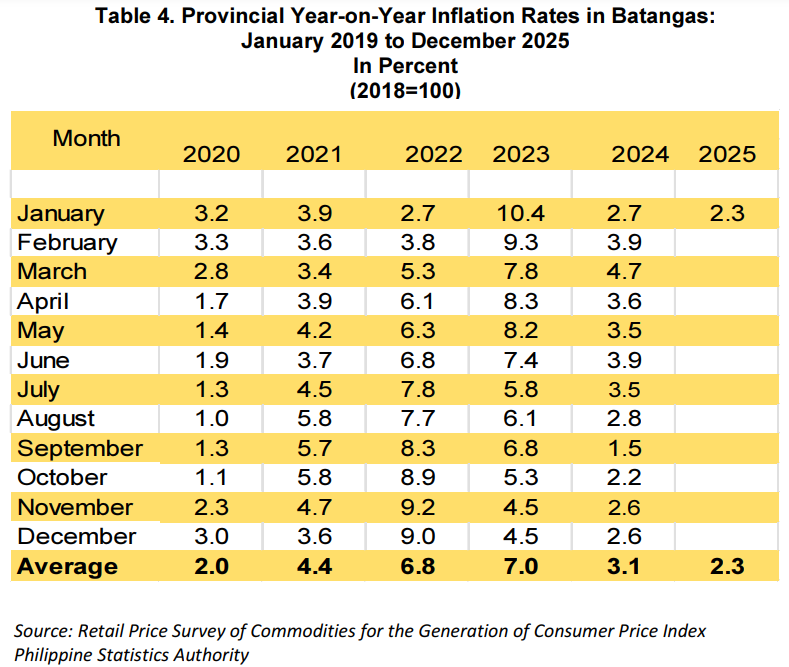
The Batangas Province headline inflation or overall inflation decreased at 2.3 percent inJanuary 2025. (Table 1 and Figure 1)
On the other hand, Region IV-A CALABARZON decreased to 3.1 percent in January 2025 from 3.3 in December 2024. In CALABARZON, Batangas with 2.3 inflation rate placed fourth to Quezon at 5.8 percent, (first), Rizal at 4.2 percent (second) and Laguna at 3.3 percent (third) inflation rate in January 2025.
Moreover, Philippines headline inflation in January 2025 remained at 2.9 percent, the same annual growth rate recorded in December 2024. Inflation in January 2024 was posted at 2.8 percent. (Table 1)
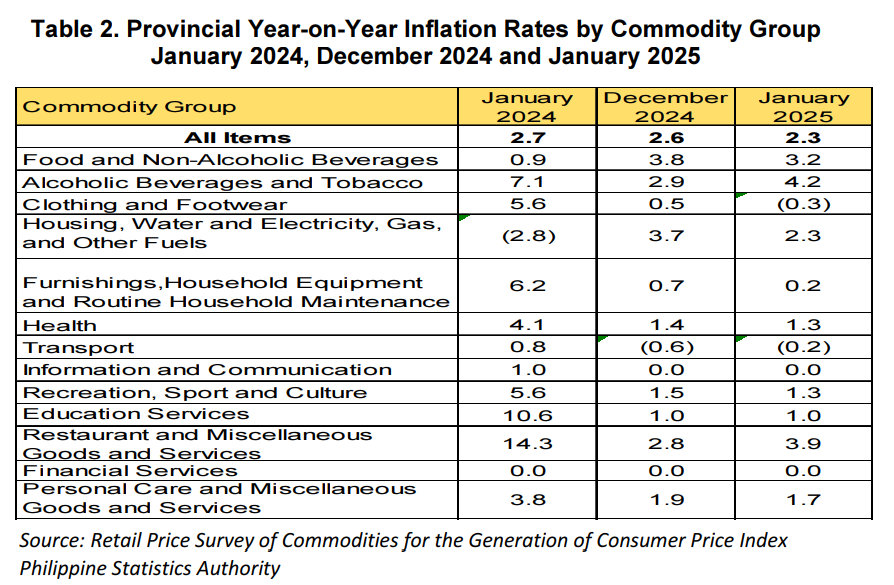
Faster annual decreases were observed in the indices of the following commodity groups during the month:
a. Housing, water, electricity, gas and other fuels, 2.3 percent from 3.7 percent
b. Food and Non-Alcoholic Beverages, 3.2 percent from 3.8 percent
c. Clothing and Footwear, -0.3 percent from 0.5 percent
d. Furnishings, household equipment and routine household maintenance, 0.2 percent from 0.7 percent
e. Personal care, and miscellaneous goods and services, 1.7 percent from 1.9 percent
f. Health, 1.3 percent from 1.4 percent
g. Recreation, Sport and Culture, 1.3 percent from 1.5 percent
Meanwhile, information and communication, and financial services remained at zero percent inflation rate in January 2025. Also, the index of education services remained at 1.0 percent during the month.
On the other hand, higher inflation rates were noted in the indices of the following commodity groups in January 2025.
a. Alcoholic Beverages and Tobacco, 4.2 percent from 2.9 percent
b. Transport, -0.2 percent from -0.6 percent
c. Restaurants and Accommodation Services, 3.9 percent from 2.8 percent
The food and non-alcoholic beverages, which registered an inflation rate of 3.2 percent in January 2025, contributed 45.6 percent or 1.05 percentage points to the overall inflation during the month.
Other main contributors to the January 2025 inflation were the following:
a. Housing, water, electricity, gas and other fuels with 23.1 percent share or 0.53 percentage point and
b. Restaurants and Accommodation Services with 21.0 percent share or 0.48 percentage point
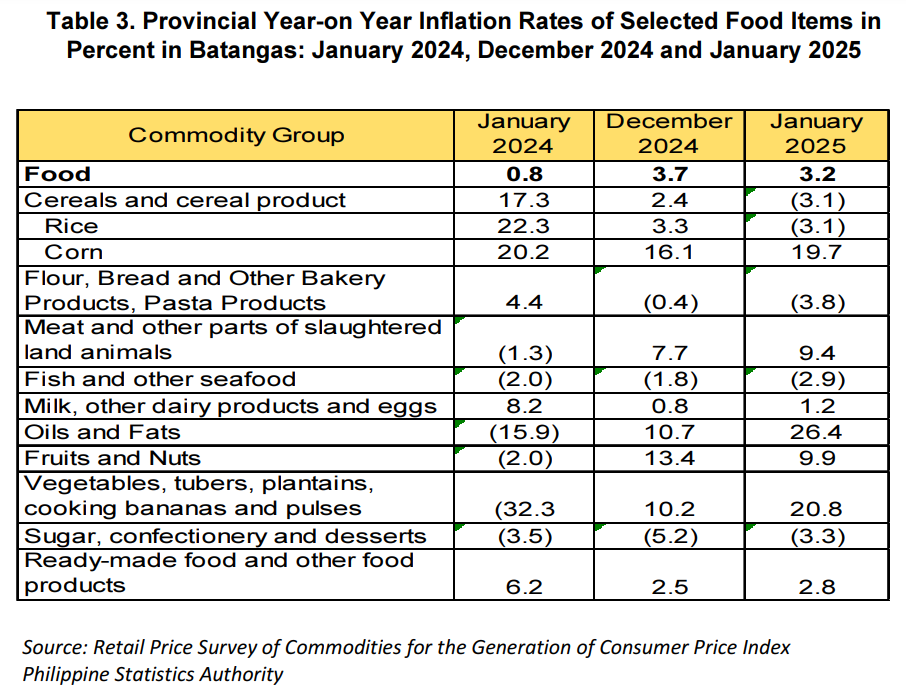
Food inflation in Batangas down to 3.2 percent in January 2025 from 3.8 percent in the previous month. In January 2024, food inflation was lower at 0.8 percent. (Table 3)
The deceleration of food inflation in January 2025 was primarily brought about by the lower inflation rate of cereals and cereal products at -3.1 percent from 2.4 percent in December 2024. Also contributed to the downtrend of the food inflation were the faster decreases in the indices of fish and other seafood at -2.9 percent during the month from -1.8 percent in the previous month and fruits and nuts at 9.9 percent from 13.4 percent in the previous month. Moreover, the index of flour, bread and other bakery products, pasta products and other cereals is down to -3.8 percent during the month from -0.4 percent in the previous month.
On the contrary, higher annual growth rates during the month were observed in the indices of the following food groups:
a. Corn 19.7 percent from 16.1 percent
b. Meat and other parts of slaughtered land animals 9.4 percent from 7.7 percent
c. Milk, other dairy products and eggs 1.2 percent from 0.8 percent
d. Oils and Fats 26.4 percent from 10.7 percent
e. Vegetables, tubers, plantains, cooking bananas and pulses 20.8 percent from 10.2 percent
f. Sugar, confectionery and desserts from -3.3 percent from -5.2 percent
g. Ready-made food and other food products 2.8 percent from 2.5 percent
The index of rice recorded an annual decline of -3.1 percent during the month from a 3.3 percent annual increase in the previous month.
Food inflation shared 42.1 percent or 0.97 percentage points to the overall inflation in January 2025. The top three food groups in terms of contribution to the food inflation during the month were the following:
a. Meat and other parts of slaughtered land animals with a share of 71.1 percent or 2.3 percentage points
b. Vegetables, tubers, plantains, cooking bananas and pulses with a share of 50.2 percent or 1.6 percentage points
c. Oils and fats with a share of 12.6 percent or 0.4 percentage points

| Attachment | Size |
|---|---|
|
|
244.92 KB |