
Release-Date
Reference-Number
2024-116
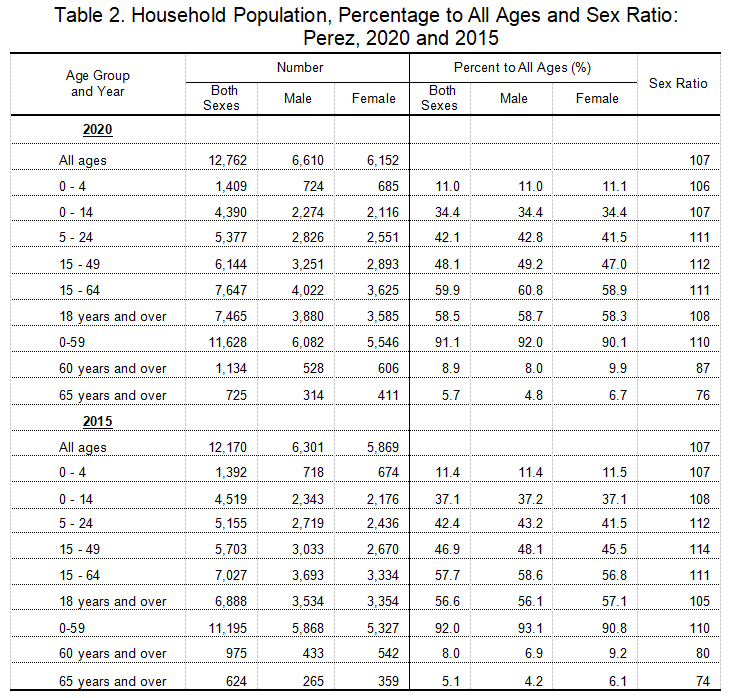
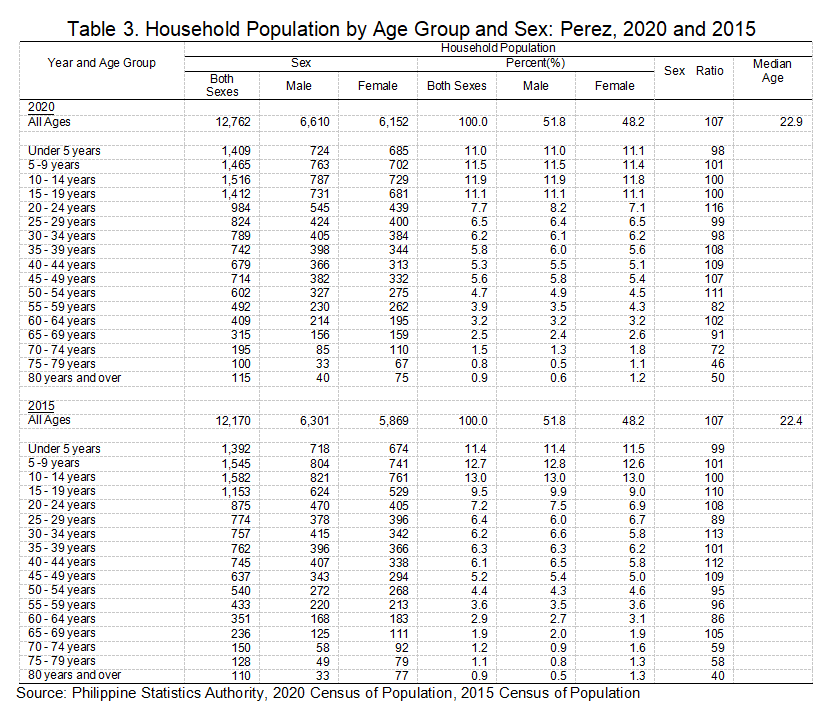
As of May 1, 2020, the household population of Perez was recorded at 12,762 individuals, based on the result of the 2020 Census of Population and Housing (2020 CPH).
Of the total household population in 2020, 6,610 (51.8%) were males while 6,152 (48.2%) were females. By age group, 4,390 persons (34.4%) were under 15 years of age (young dependents), while persons aged 15 to 64 years (working-age or economically active population) totaled 7,647 (59.9%). Those in the age group 65 years and over (old dependents) comprised the remaining 725 persons (5.7%).
In 2015, persons aged 0 to 14 years, 15 to 64 years, and 65 years and above accounted for 37.1 percent, 57.7 percent, and 5.1 percent, respectively, of the total household population.
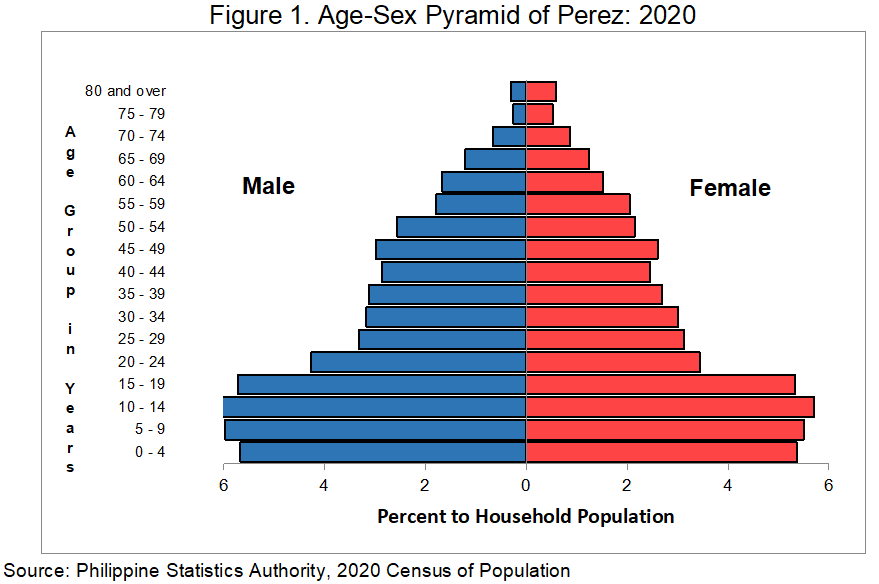
Moreover, there were more males (92.0%) than females (90.1%) among the 0 to 59 age group. Meanwhile, for older age group (60 years and over) females (9.9%) outnumbered the males (8.0%). The same trend was also observed in 2015.
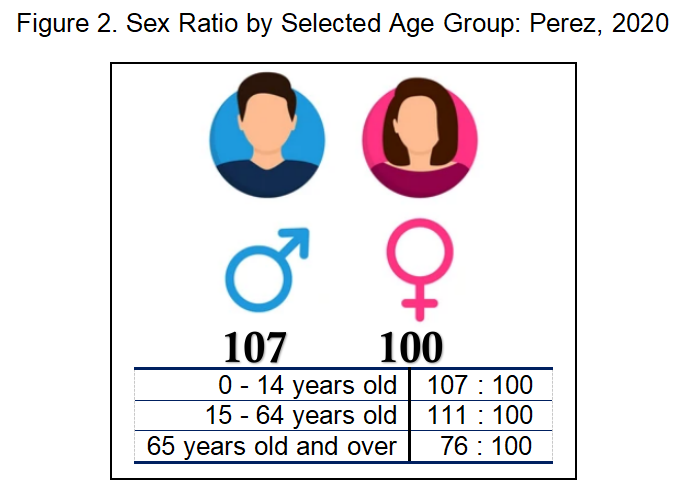
Sex ratio stands at 107 males per 100 females
The sex ratio in Perez was computed at 107 in 2020. This implies that there were 107 males for every 100 females. In 2015, the sex ratio was the same at 107 males for every 100 females.
In 2020, children aged below 15 years had a sex ratio of 107 males for every 100 females, while those aged 15 - 64 years old had a sex ratio of 111 males for every 100 females. On the other hand, those aged 65 years and over had a sex ratio of 76 males for every 100 females. This implies a higher mortality rate among males than females or a longer life expectancy among females than males in the older age groups.
Median age increases to 22.9 years
The median age in Perez was computed at 22.9 years, which means that half of the household population were younger than 22.9 years, while the other half were older than 22.9 years. The median age of 22.4 posted in 2015 was lower compared to 2020.
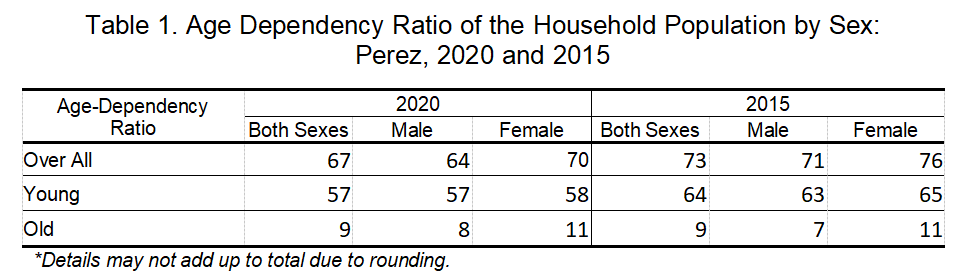
Dependency ratio declines to 67 dependents per 100 persons in the working age-group
The dependency ratio in Perez was computed at 67, which indicates that for every 100 working-age population, there were about 67 dependents (57 young dependents and 9 old dependents). This is lower than the dependency ratio in 2015 at 73 dependents (64 young dependents and 9 old dependents).
There are more males than females among children under five years old
Children below five years old comprised 11.0 percent (1,409) of the household population. The sex ratio was computed at 106 males for every 100 females.
About two in every five household population are of school age
The school-age population (5 to 24 years old) accounted for 5,377 persons (42.1%) of the 12,762 household population in Perez. This total is higher compared to the 5,155 (42.4%) school-age population that was reported in 2015.
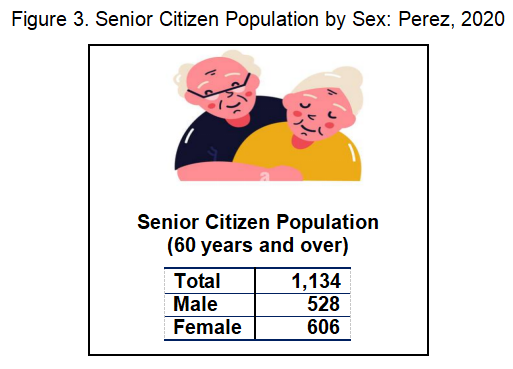
Senior citizens constitute 8.9 percent of the household population
People aged 60 years old and over are regarded as senior citizens in the Philippines. They made up 8.9 percent (1,134) of the household population in 2020. There were more females (606 or 53.4%) than males (528 or 46.6%) among the senior citizens. The same trend was observed in 2015 where females (542 or 55.6%) outnumbered their male counterpart (433 or 44.4%).
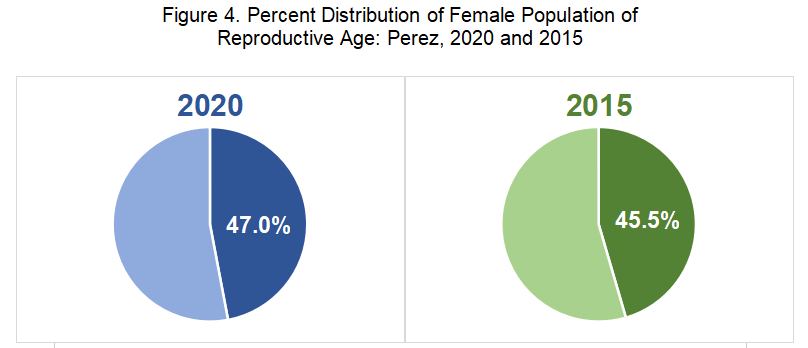
Less than half of the female population are of reproductive age
Women of reproductive age (15 - 49 years old) totaled 2,893 or 47.0 percent of the 6,152 female household population in 2020. In 2015, there were 2,670 females of reproductive age, comprising 45.5 percent of the female household population during the year.
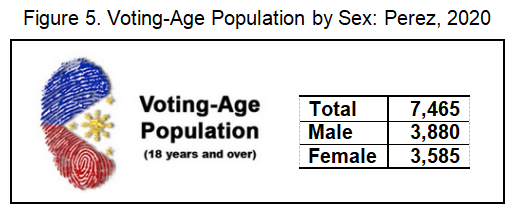
About 59.0 percent of the household population are of voting age
The voting-age population (18 years old and over) accounted for 58.5 percent (7,465) of the household population in 2020, up from 56.6 percent (6,888) in 2015.
(SGD.) AIRENE A. PUCYUTAN
Provincial Statistics Officer
AAP/NDP/MGC/IJCA/DOC
| Attachment | Size |
|---|---|
|
|
1.94 MB |