
Release-Date
Reference-Number
2024-113
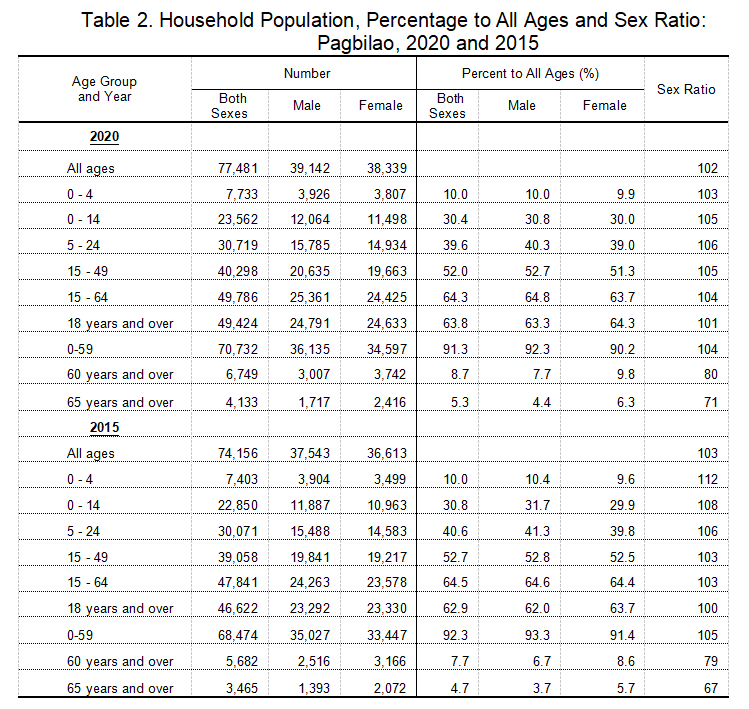
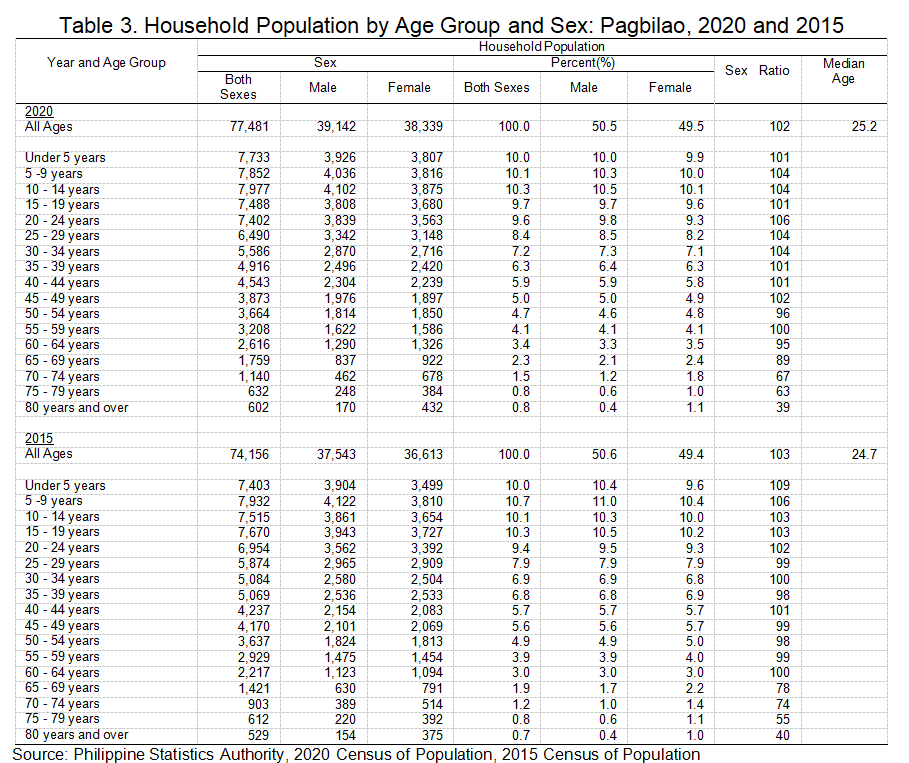
As of May 1, 2020, the household population of Pagbilao was recorded at 77,481 individuals, based on the result of the 2020 Census of Population and Housing (2020 CPH).
Of the total household population in 2020, 39,142 (50.5%) were males while 38,339 (49.5%) were females. By age group, 23,562 persons (30.4%) were under 15 years of age (young dependents), while persons aged 15 to 64 years (working-age or economically active population) totaled 49,786 (64.3%). Those in the age group 65 years and over (old dependents) comprised the remaining 4,133 persons (5.3%).
In 2015, persons aged 0 to 14 years, 15 to 64 years, and 65 years and above accounted for 30.8 percent, 64.5 percent, and 4.7 percent, respectively, of the total household population.
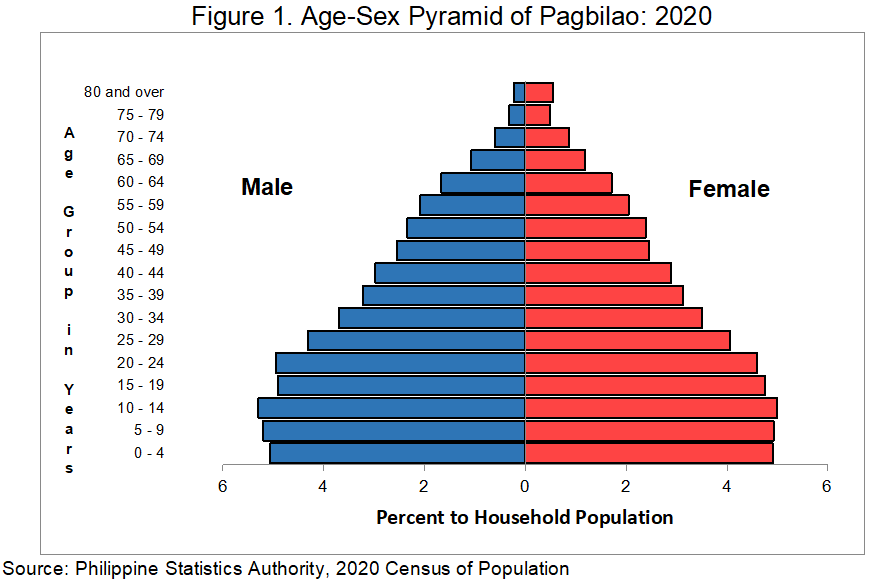
Moreover, there were more males (92.3%) than females (90.2%) among the 0 to 59 age group. Meanwhile, for older age group (60 years and over) females (9.8%) outnumbered the males (7.7%). The same trend was also observed in 2015.
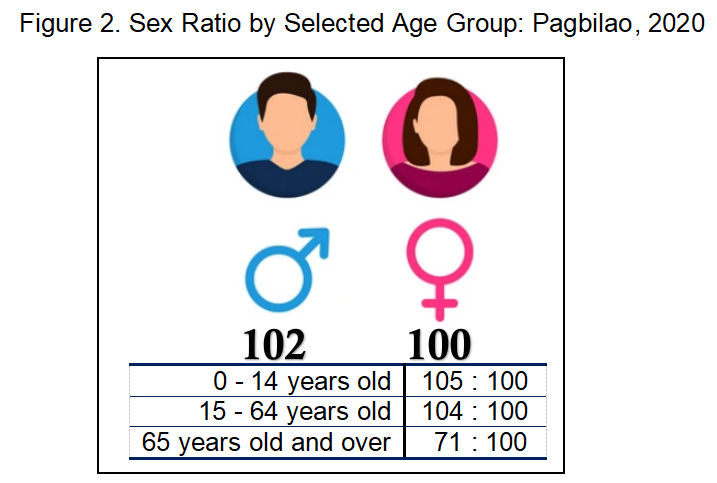
Sex ratio stands at 102 males per 100 females
The sex ratio in Pagbilao was computed at 102 in 2020. This implies that there were 102 males for every 100 females. In 2015, the sex ratio was 103 males for every 100 females.
In 2020, children aged below 15 years had a sex ratio of 105 males for every 100 females, while those aged 15 - 64 years old had a sex ratio of 104 males for every 100 females. On the other hand, those aged 65 years and over had a sex ratio of 71 males for every 100 females. This implies a higher mortality rate among males than females or a longer life expectancy among females than males in the older age groups.
Median age increases to 25.2 years
The median age in Pagbilao was computed at 25.2 years, which means that half of the household population were younger than 25.2 years, while the other half were older than 25.2 years. The median age of 24.7 posted in 2015 was lower compared to 2020.
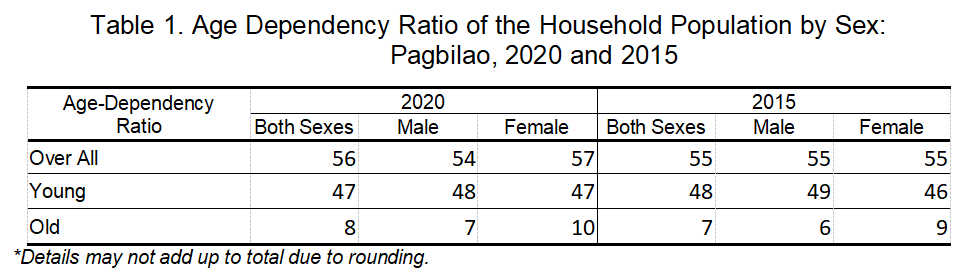
Dependency ratio increases at 56 dependents per 100 persons in the working age-group
The dependency ratio in Pagbilao was computed 56, which indicates that for every 100 working-age population, there were about 56 dependents (47 young dependents and 8 old dependents). This is higher than the dependency ratio in 2015 at 55 dependents (48 young dependents and 7 old dependents).
There are more males than females among children under five years old
Children below five years old comprised 10.0 percent (7,733) of the household population. The sex ratio was computed at 103 males for every 100 females.
About two in every five household population are of school age
The school-age population (5 to 24 years old) accounted for 30,719 persons (39.6%) of the 77,481 household population in Pagbilao. This total is higher compared to the 30,071 (40.6%) school-age population that was reported in 2015.
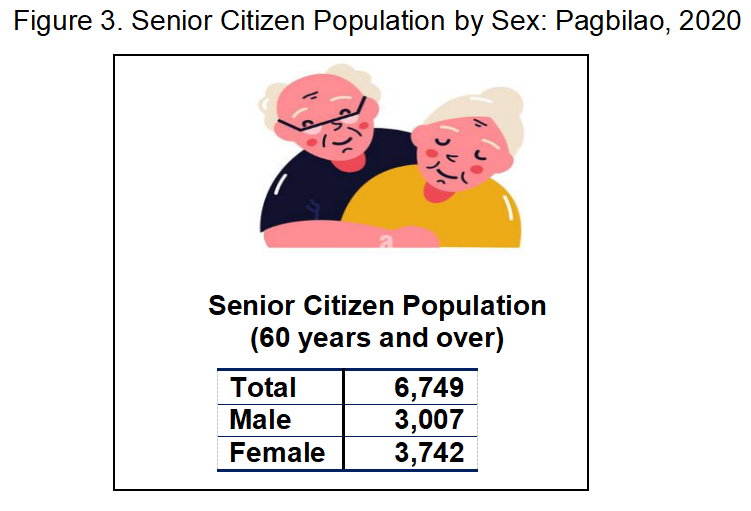
Senior citizens constitute 8.7 percent of the household population
People aged 60 years old and over are regarded as senior citizens in the Philippines. They made up 8.7 percent (6,749) of the household population in 2020. There were more females (3,742 or 55.4%) than males (3,007 or 44.6%) among the senior citizens. The same trend was observed in 2015 where females (3,166 or 55.7%) outnumbered their male counterpart (2,516 or 44.3%).
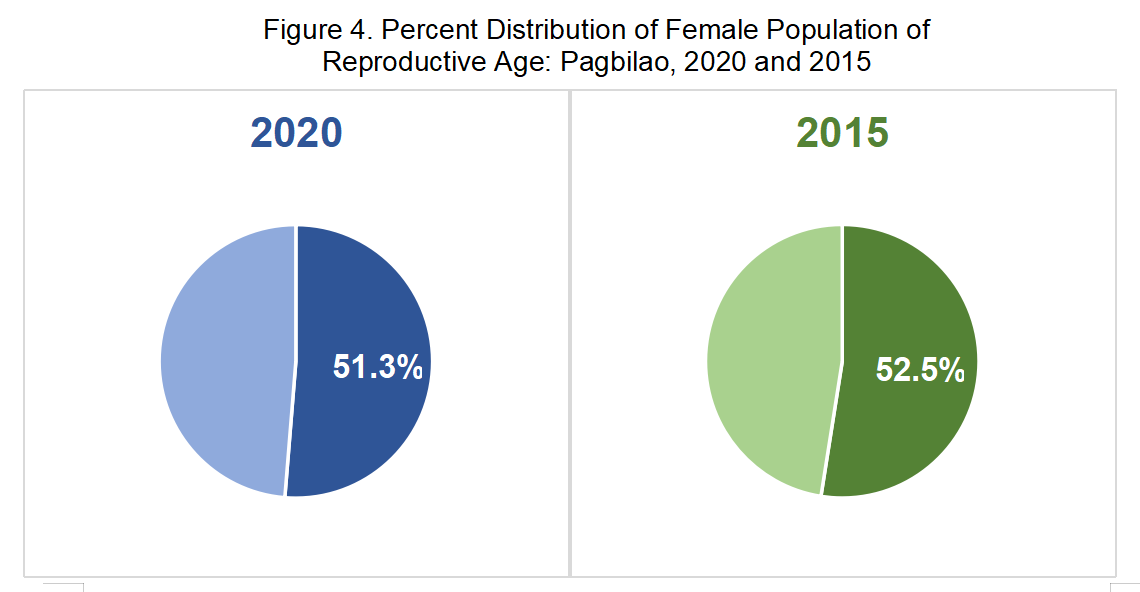
More than half of the female population are of reproductive age
Women of reproductive age (15 - 49 years old) totaled 19,663 or 51.3 percent of the 38,339 female household population in 2020. In 2015, there were 19,217 females of reproductive age, comprising 52.5 percent of the female household population during the year.
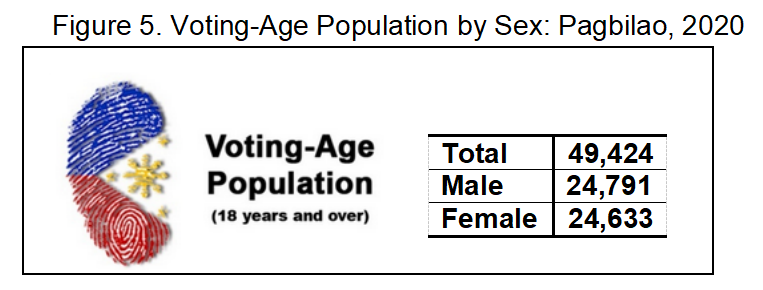
About 64.0 percent of the household population are of voting age
The voting-age population (18 years old and over) accounted for 63.8 percent (49,424) of the household population in 2020, up from 62.9 percent (46,622) in 2015.
(SGD.) AIRENE A. PUCYUTAN
Provincial Statistics Officer
AAP/NDP/MGC/IJCA/DOC
| Attachment | Size |
|---|---|
|
|
1.96 MB |