
Release-Date
Reference-Number
2025-148
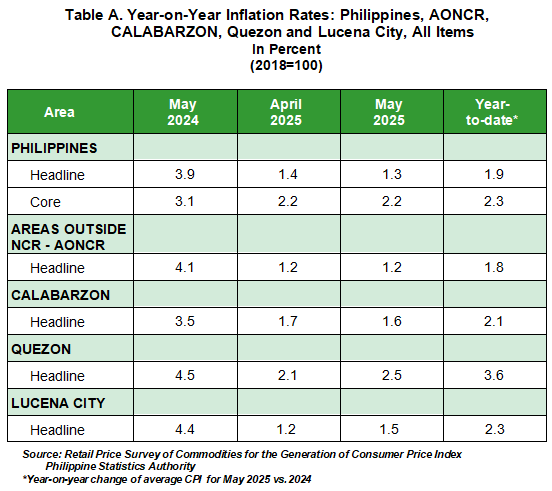
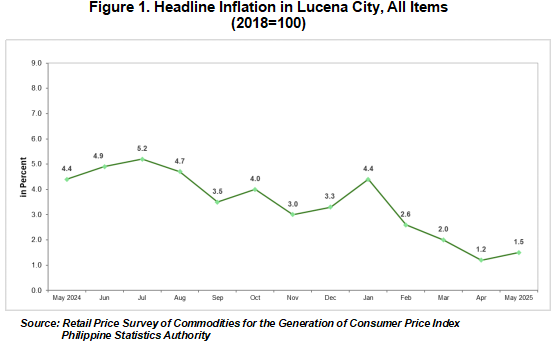
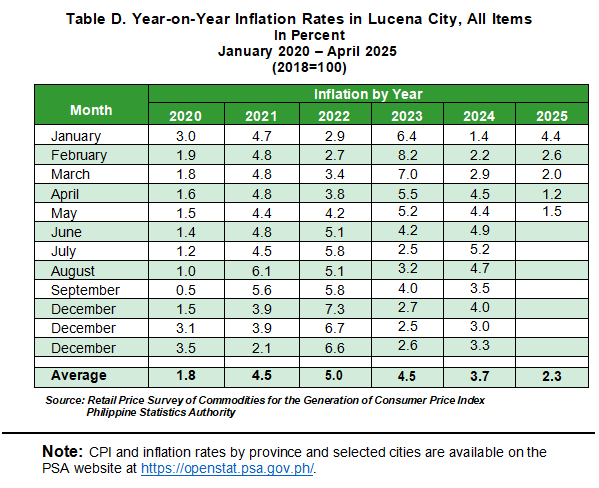
The headline inflation or overall inflation in Lucena City increased to 1.5 percent in May 2025, from 1.2 percent in April 2025. This brings the average inflation rate of the city from January to May 2025 to 2.3 percent. In May 2024, the inflation rate was higher at 4.4 percent.
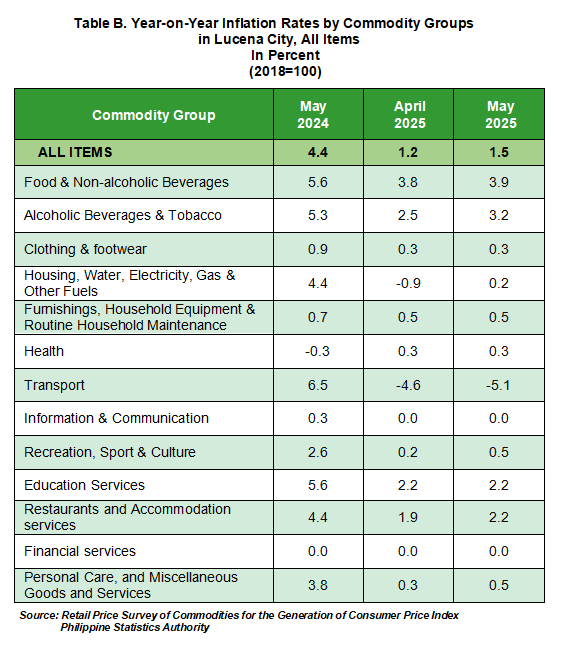
The acceleration in the inflation rate of Lucena City was primarily influenced by the higher annual increase in housing, water, electricity, gas and other fuels, which rose to 0.2 percent during the month from -0.9 percent in the previous month.
Also contributing to the increase in overall inflation were the higher annual increments in the indices of the following commodity groups during the month:
a. Food and non-alcoholic beverages at 3.9 percent, from 3.8 percent;
b. Alcoholic beverages and tobacco at 3.2 percent, from 2.5 percent;
c. Recreation, sport and culture at 0.5 percent, from 0.2 percent;
d. Restaurants and accommodation services at 2.2 percent, from 1.9 percent; and
e. Personal care, and miscellaneous goods and services at 0.5 percent, from 0.3 percent.
In contrast, the transport commodity group recorded a lower inflation rate at -5.1 percent, from -4.6 percent in April 2025.
Moreover, the following commodity groups retained their previous month’s inflation:
a. Clothing and footwear at 0.3 percent;
b. Furnishings, household equipment and routine household maintenance at 0.5 percent;
c. Health at 0.3 percent;
d. Information and communication at 0.0 percent;
e. Education services at 2.2 percent; and
f. Financial services at 0.0 percent.
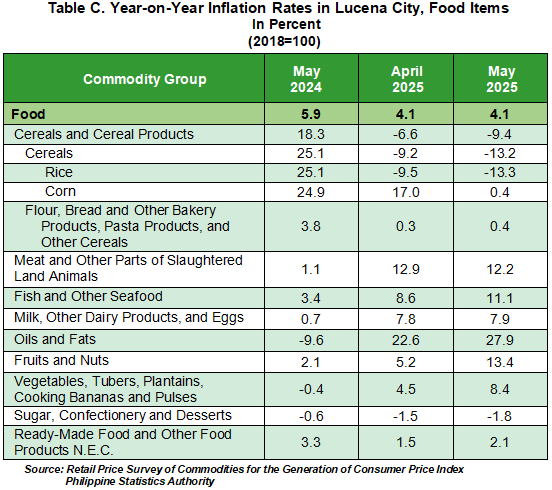
Food inflation in Lucena City remained at 4.1 percent in May 2025. This was lower compared to the 5.9 percent food inflation rate recorded in May 2024.
Meanwhile, the following food groups recorded higher annual growth rates during the month:
a. Flour, bread and other bakery products, pasta products, and other cereals at 0.4 percent, from 0.3 percent;
b. Fish and other seafood at 11.1 percent, from 8.6 percent;
c. Milk, other dairy products and eggs at 7.9 percent, from 7.8 percent;
d. Oils and fats at 27.9 percent, from 22.6 percent;
e. Fruits and nuts at 13.4 percent, from 5.2 percent;
f. Vegetables, tubers, plantains, cooking bananas and pulses at 8.4 percent, from 4.5 percent; and
g. Ready-made food and other food products not elsewhere classified at 2.1 percent, from 1.5 percent.
On the contrary, lower annual growth rates during the month were observed in the indices of the following food groups:
a. Rice at -13.3 percent, from -9.5 percent;
b. Corn at 0.4 percent, from 17.0 percent;
c. Meat and other parts of slaughtered land animals at 12.2 percent, from 12.9 percent; and
d. Sugar, confectionery and desserts at -1.8 percent, from -1.5 percent.
(SGD.) AIRENE A. PUCYUTAN
Provincial Statistics Officer
PSA Quezon
NDP/MGF/SCNG
| Attachment | Size |
|---|---|
|
|
2.71 MB |