
Release-Date
Reference-Number
2024-017
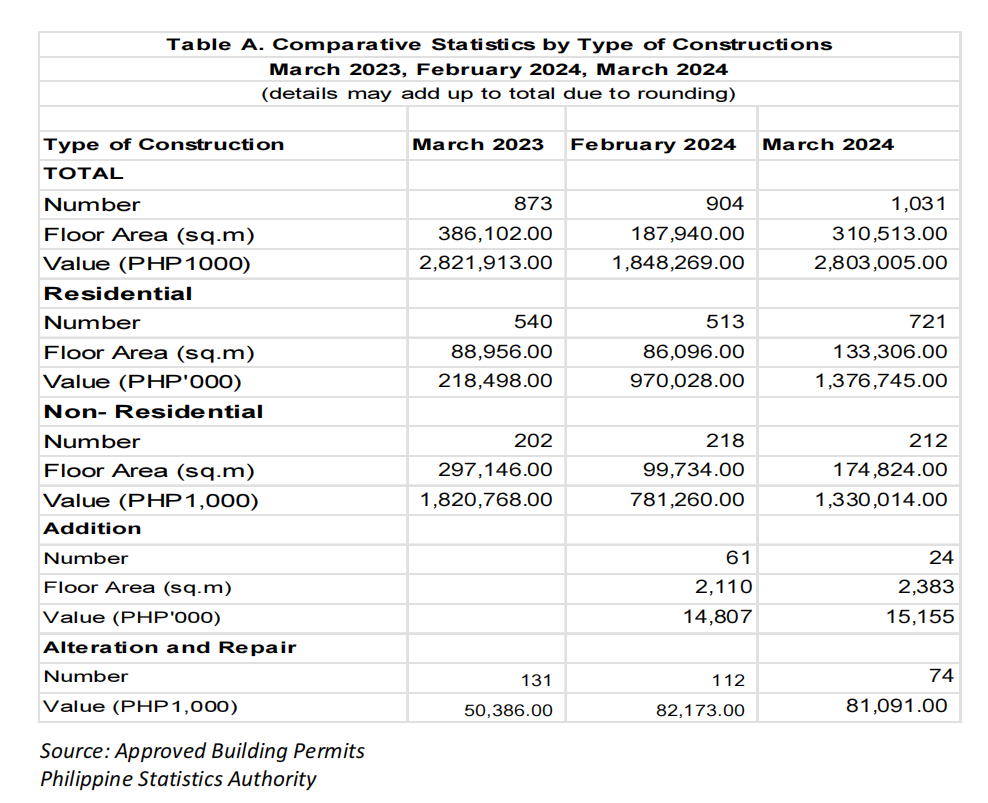
The number of constructions from approved building permits in March 2024 reached 1,031. This indicates an annual increase of 18.1 percent from the 873 total number of constructions in the same month of the previous year. The number of constructions in February 2024 declined at annual rate of 16.0 percent. (Table A)
By type of construction, residential buildings reported the highest number with 721 constructions or 69.9 percent of the total number of constructions during the month. This indicates an annual increase of 33.5 percent from the same month of the previous year’s level of 540 constructions. Majority of the total residential constructions were single - type houses with 530 (73.5%). (Table A, Figure 1)
Meanwhile, non-residential type of constructions was the second highest in terms of number of constructions of 212 or 20.6 percent of the total number of constructions during the month. This type of construction declined during the period at an annual rate of 5.0 percent. Most of the non-residential constructions were commercial buildings with 139 (65.6%) (Figure 1).
Addition, which refers to any new construction that increases the height or area of an existing building, and alteration and repair of existing structures contributed 2.33 percent. Compared with their respective numbers in the same period of the previous year, addition-type of construction retained at zero while alteration and repair posted an annual decrease of -43.5 percent (Table A).
Residential buildings recorded the highest value of constructions
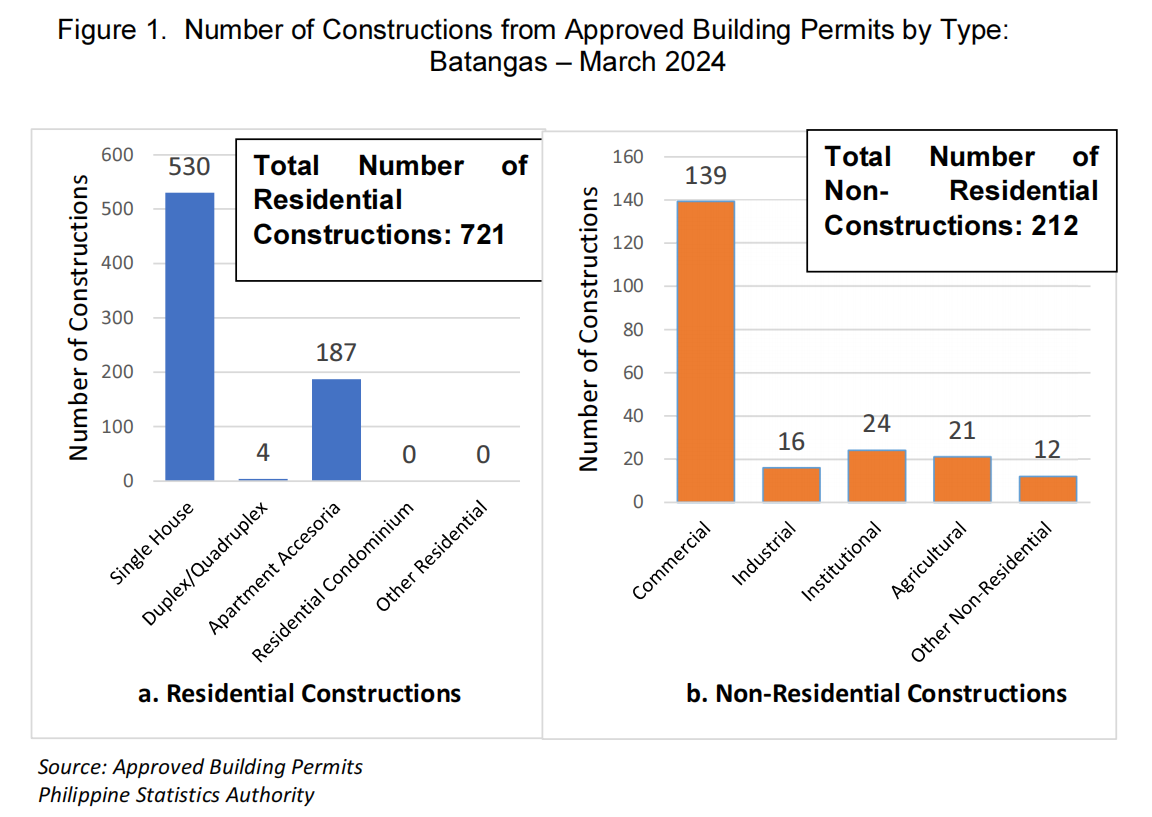
In March 2024, the total value of constructions amounted to PhP 2.803,005 million, reflecting an annual decline of -0.7 percent from the PhP 2,821,913 million value of constructions posted in the same month of the previous year. (Table A, Figure 2)
Residential building constructions valued at PhP 1,376,745 thousand accounted for 49.1 percent of the total value of constructions during the period. This indicates an increase of 530.1 percent from the PhP 218,498 thousand construction value of residential buildings recorded in the same month of 2023. Among residential constructions, single type of houses had the highest value of constructions at PhP 810,179 thousand (58.8%). (Figure 2)
On the other hand, the construction value of non-residential buildings amounted to PhP1,330,014 million or 47.4 percent of the total construction value in March 2024. This reflects a decrement of -27.0 percent from the PhP 1,820,768 million value of constructions of non-residential buildings reported in the same month of the previous year.
In March 2024, the value of constructions for addition to, and alteration and repair to existing structures were recorded at PhP15,155 thousand (0.54%) and PhP 81,091 thousand (2.9%), respectively. Compared with their respective values in the same month of the previous year, alteration and repair posted an annual drop of 2.9 percent from an annual growth rate of 60.9 percent.
Non-residential buildings accounted for more half of the total floor area of constructions
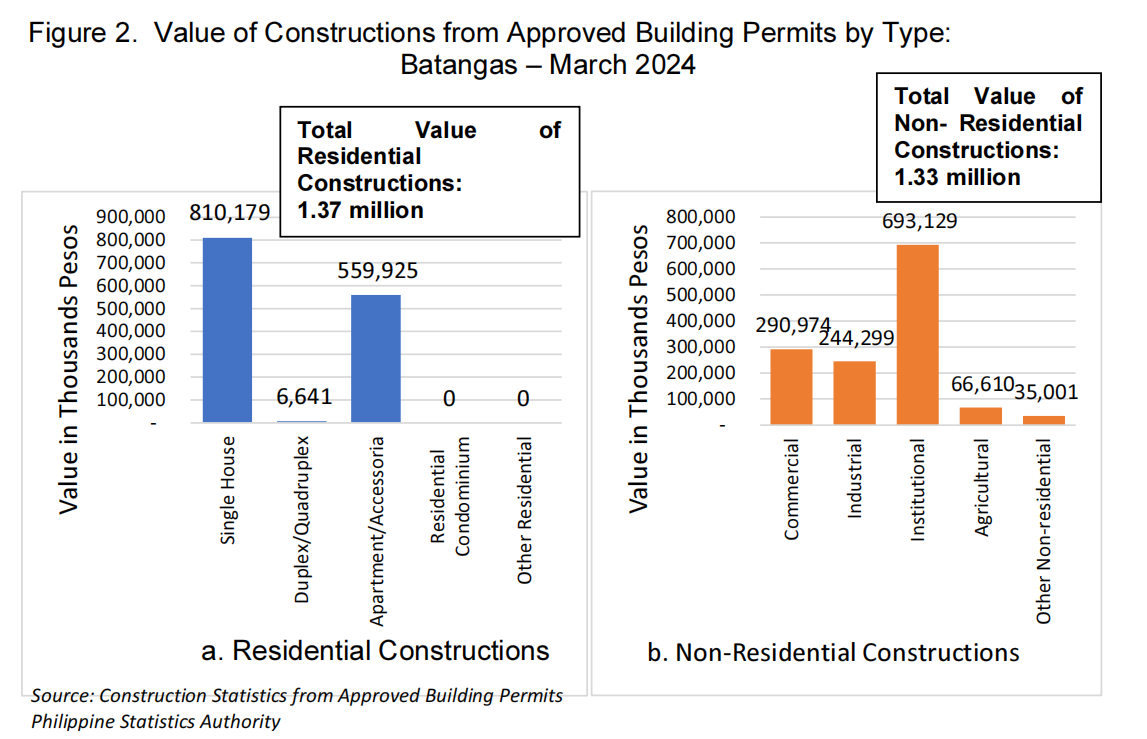
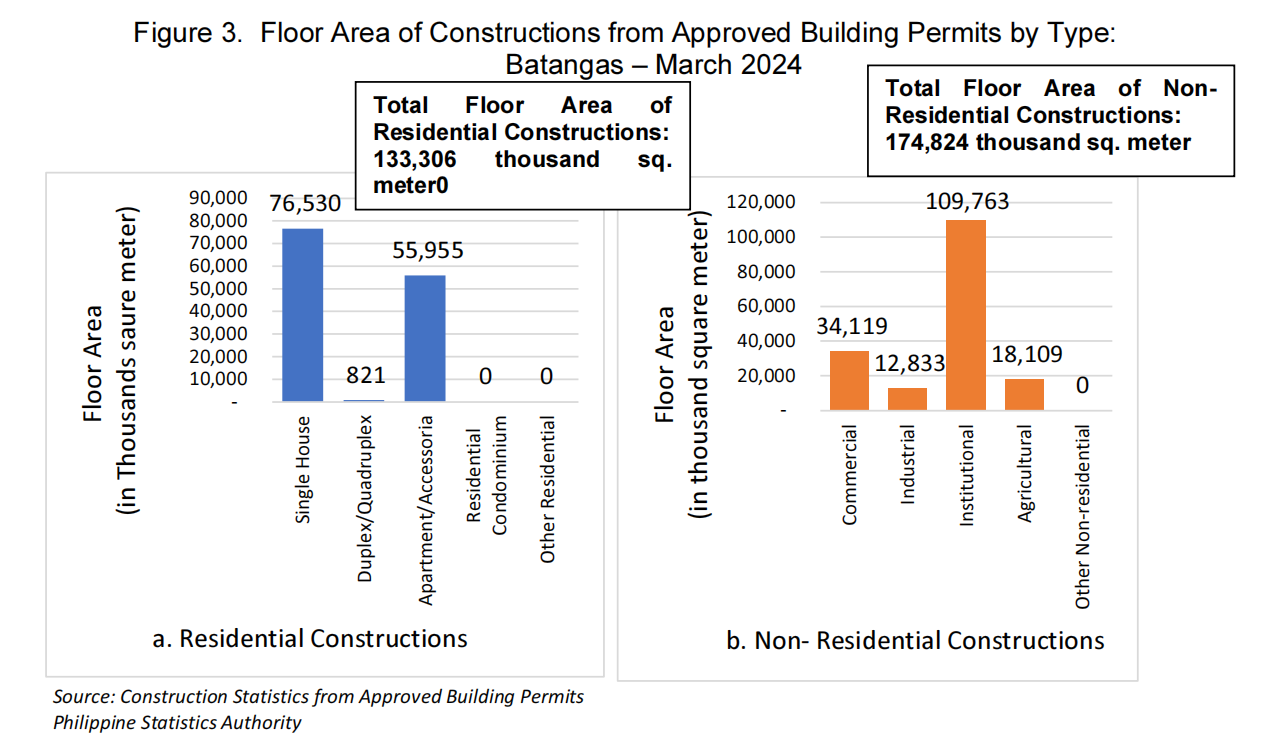
The total floor area of constructions for this month was recorded at 310,513 thousand square meters. This corresponds to an annual decrease of -19.6 percent from the recorded 386,102 thousand square meters floor area in the same period of the previous year. (Table A, Figure 3)
Non-residential constructions posted 174,824 thousand square meters or 56.3 percent of the total floor area of constructions this period. This reflects an annual decline of -41.2 percent from the floor area of 297,146 thousand square meters in the same month of 2023.
Meanwhile, residential constructions recorded 133,306 thousand square meters or 42.9 percent of the total floor area of constructions in March 2024. It increased at an annual rate of 49.9 percent from the previous year’s same month floor area of 88,956 thousand square meters.
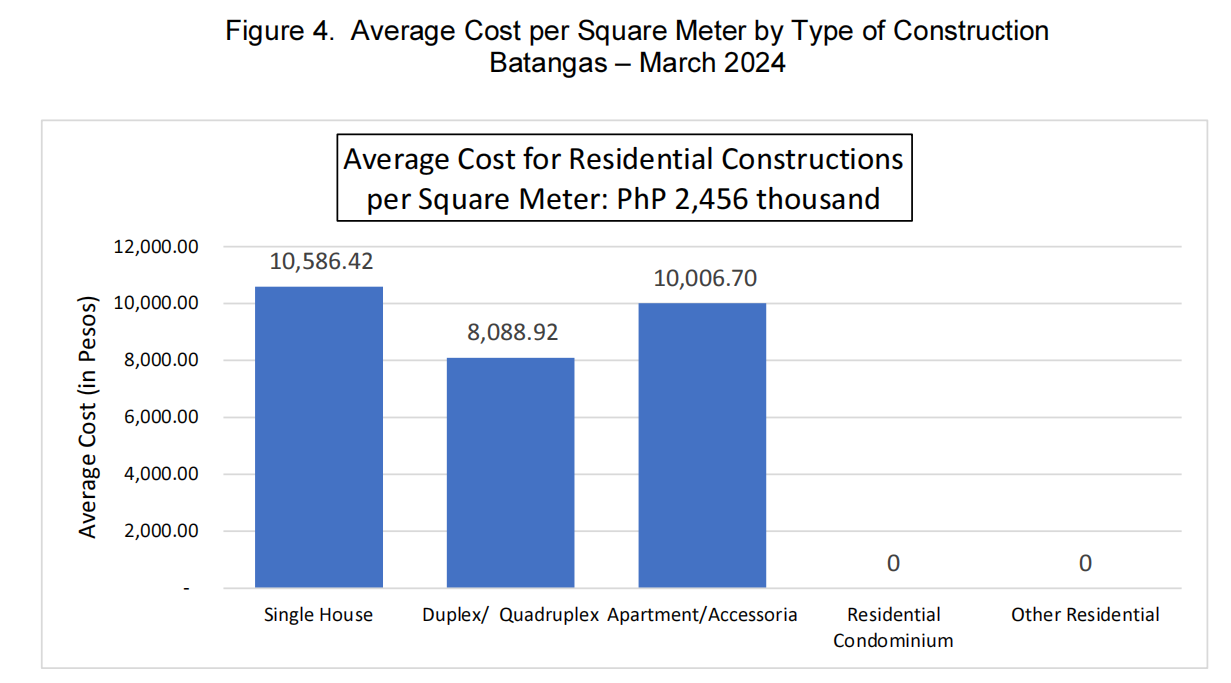
Non- Residential buildings had the highest average cost of constructions
The average cost of construction in March 2024, excluding those for alteration and repair, and other non-residential was recorded at PhP 8,653.13 per square meter. This was 18.4 percent lower than the average cost of PhP7,308.72 per square meter in 2023 (Table A).
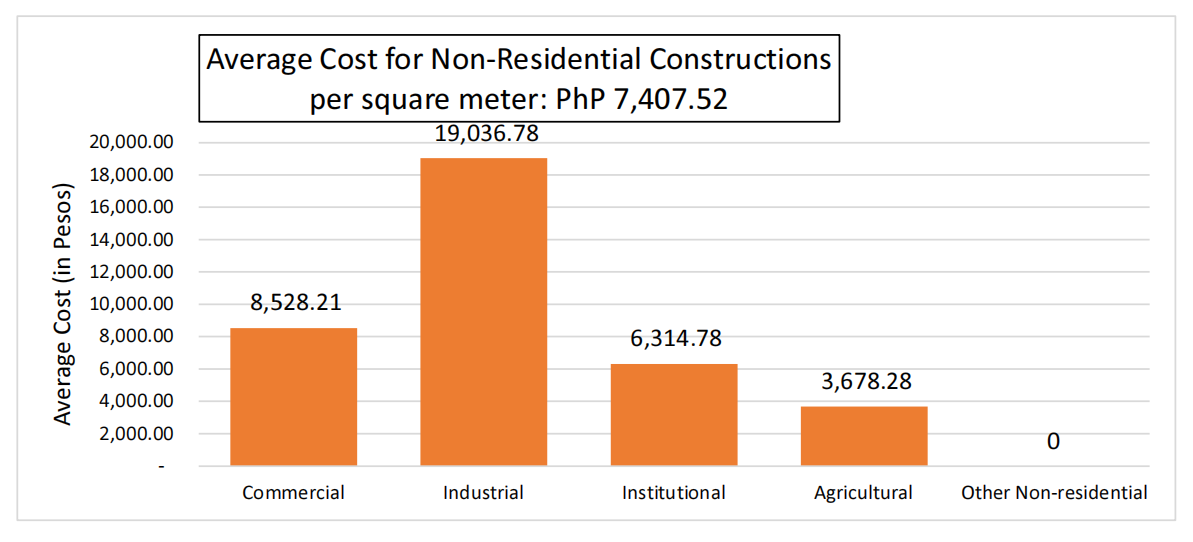
By type of construction, non- residential buildings had the highest average cost of PhP 7,407.52 per square meter during the month. This was followed by residential constructions with PhP2,456 per square meter, and addition to existing constructions with PhP 6,359.63 per square meter.
Among non-residential constructions, industrial type building posted the highest average cost of PhP 19,036.78 per square meter during the period, while agricultural type buildings recorded the lowest average cost of PhP3,678.28 per square meter.
Across residential constructions, single type houses reported the highest average cost of PhP 10,586.42 per square meter. On the other hand, duplex/quadruplex registered the lowest average cost of PhP 8,088.92 per square meter.

| Attachment | Size |
|---|---|
|
|
289.78 KB |