
Release-Date
Reference-Number
2025-108
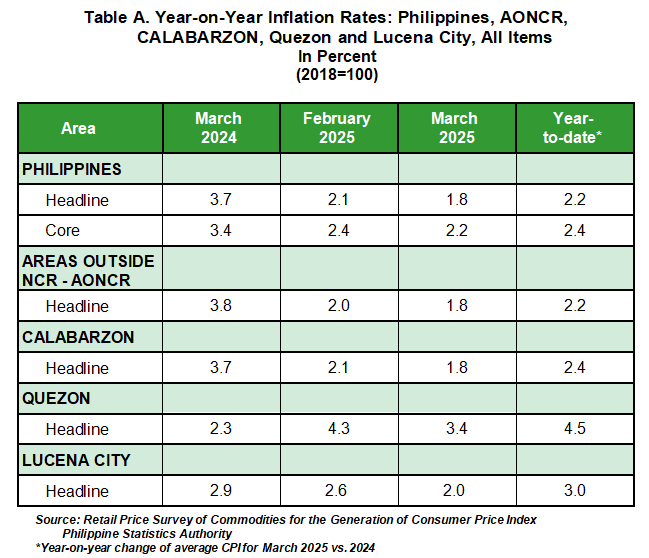
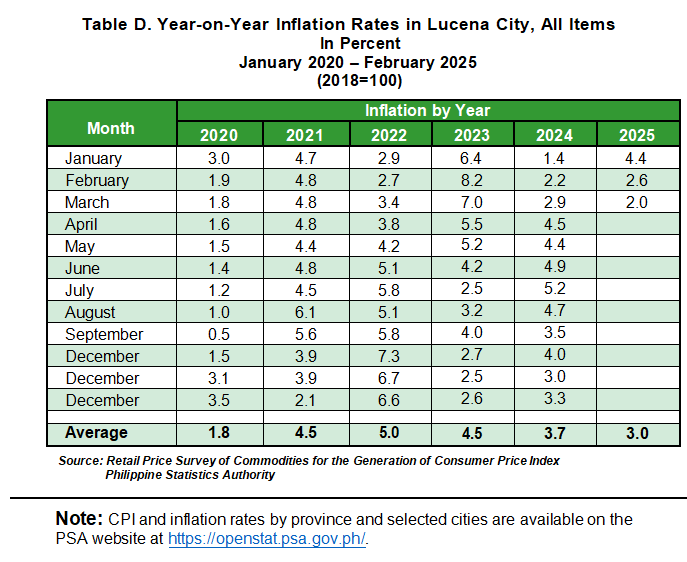
The headline inflation or overall inflation in Lucena City continued to decrease at 2.0 percent in March 2025, down from 2.6 percent in February 2025. This brings the average inflation rate of the city from January to March 2025 to 3.0 percent. In comparison, the inflation rate in March 2024 was higher at 2.9 percent.
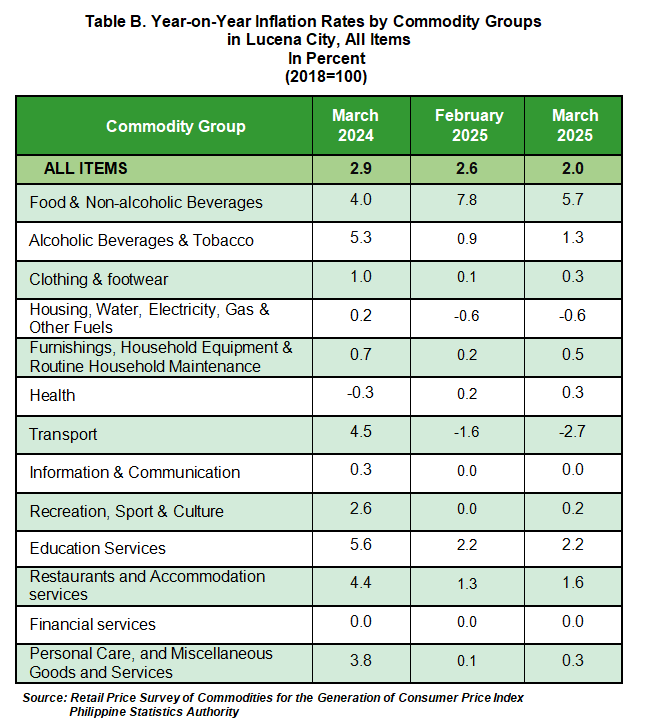
The continued downtrend in Lucena City’s overall inflation rate in March 2025 was primarily driven by the slower annual increase in the heavily weighted food and non-alcoholic beverages, which eased to 5.7 percent from 7.8 percent in the previous month. The transport group also contributed to the overall decline, with its rate dropping further to -2.7 percent from -1.6 percent.
In contrast, the following commodity groups recorded higher inflation rates during the month:
a. Alcoholic beverages and tobacco at 1.3 percent, from 0.9 percent;
b. Clothing and footwear at 0.3 percent, from 0.1 percent;
c. Furnishings, household equipment and routine household maintenance at 0.5 percent, from 0.2 percent;
d. Health at 0.3 percent, from 0.2 percent;
e. Recreation, sport and culture at 0.2 percent, from 0.0 percent;
f. Restaurants and accommodation services at 1.6 percent, from 1.3 percent; and
g. Personal care, and miscellaneous goods and services at 0.3 percent, from 0.1 percent.
Meanwhile, inflation rates for the following commodity groups remained unchanged from the previous month:
a. Housing, water, electricity, gas and other fuels at -0.6 percent;
b. Information and communication at 0.0 percent;
c. Education services at 2.2 percent; and Financial services at 0.0 percent.
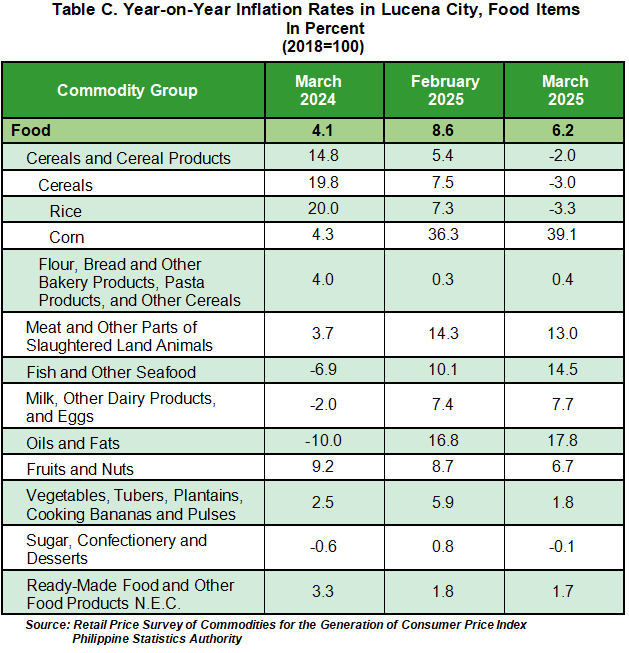
Food inflation in Lucena City eased to 6.2 percent in March 2025 from 8.6 percent in February 2025. However, it was higher compared to the food inflation rate in March 2024, which was recorded at 4.1 percent.
The deceleration of food inflation in the city was mainly driven by the significant drop in the inflation rate of rice which declined to -3.3 percent from 7.3 percent in the previous month.
Other food groups that contributed to the decline in food inflation were the following:
a. Meat and other parts of slaughtered land animals at 13.0 percent, from 14.3 percent;
b. Fruits and nuts at 6.7 percent, from 8.7 percent;
c. Vegetables, tubers, plantains, cooking bananas and pulses at 1.8 percent, from 5.9 percent;
d. Sugar, confectionery and desserts at -0.1 percent, from 0.8 percent; and
e. Ready-made food and other food products not elsewhere classified at 1.7 percent, from 1.8 percent.
In contrast, the following food groups recorded higher annual growth rates during the month:
a. Corn at 39.1 percent, from 36.3 percent;
b. Flour, bread and other bakery products, pasta products, and other cereals at 0.4 percent, from 0.3 percent;
c. Fish and other seafood at 14.5 percent, from 10.1 percent;
d. Milk, other dairy products and eggs at 7.7 percent, from 7.4 percent; and Oils and fats at 17.8 percent, from 16.8 percent.
(SGD.) AIRENE A. PUCYUTAN
Provincial Statistics Officer
PSA Quezon
NDP/MGF/SCNG
| Attachment | Size |
|---|---|
|
|
1.01 MB |