
Release-Date
Reference-Number
2024-SR-037
This report presents the Headline Inflation Rate (IR) for all income households in the province of Cavite during the month of September 2024.
Inflation Rate (IR) is the annual rate of change or the year-on-year change of the CPI expressed in percent. Inflation is interpreted in terms of declining purchasing power of money.

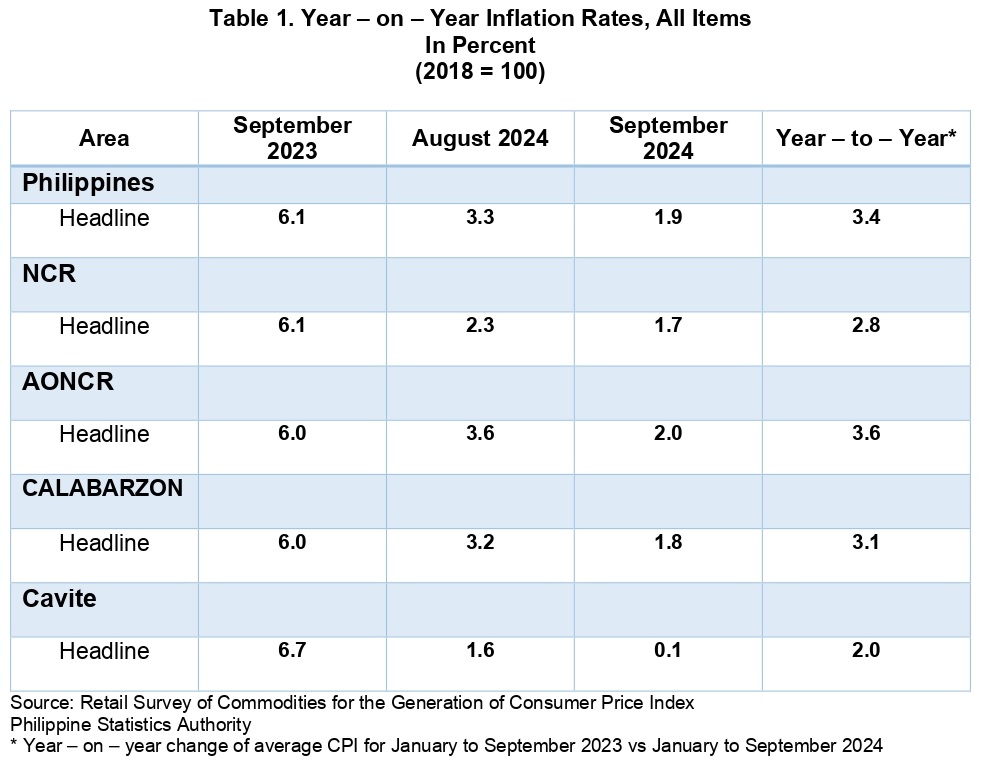
The Headline Inflation in the Province of Cavite was reported at 0.1 percent for the month of September 2024, a decrease of 1.5 percent from 1.6 percent last month (see Table 1 and Figure 1).
The deceleration in the province’s inflation rate for the month of September 2024 was primarily due to the decrease in the annual growth rate in the index of the commodity group, Food and Non-alcoholic Beverages, -1.1 percent with a 52.0 percent contribution to overall September 2024 inflation. Also contributing to the downtrend in overall inflation were the decreases in the indices of the following commodity groups:
• Transport, 1.2 percent
• Housing, Water, Electricity, Gas and Other Fuels, -2.1 percent
• Restaurant and Accommodation Services, 3.2 percent
• Education Services, 12.4 percent
• Health, 0.5 percent
• Personal Care, and Miscellaneous Goods and Services, 1.9 percent
• Information and Communication, -0.3 percent
• Clothing and Footwear, 5.8 percent
• Recreation, Sport and Culture, 1.4 percent
• Furnishing, Household Equipment and Routine Household Maintenance, 3.0 percent
Meanwhile, the commodity groups Alcoholic Beverages and Tobacco (1.8 percent) and Financial Services (-4.9 percent) were stable this month.

For Food, there was a deflation for the month of September 2024 with -1.5 percent compared to reported 1.2 percent inflation last August 2024 (see Table 3).
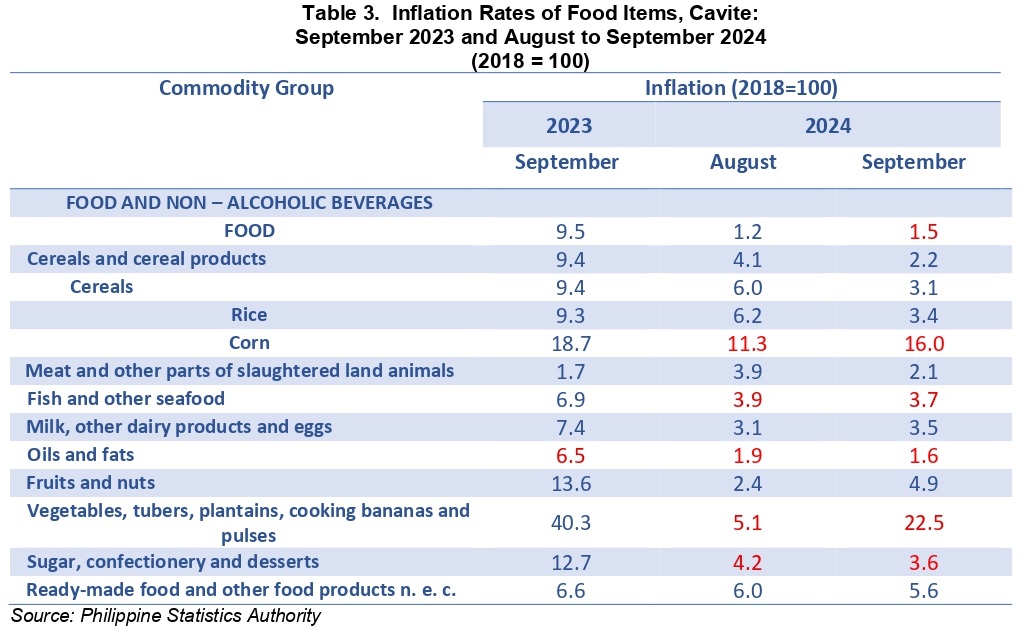
The decrease in the overall food inflation was brough by the decrease in annual growth rate of the following food groups were observed compare to last month’s inflation:
• Vegetables, tubers, plantains, cooking bananas and pulses, -22.5 percent
• Sugar, confectionery and desserts, -3.6 percent
• Ready-made food and other food products n.e.c., 5.6 percent
• Meat and other parts of slaughtered land animals, 2.1 percent
• Cereals and cereal products, 2.2 percent
Meanwhile, there were increase in the annual growth rate of the following food groups:
• Fish and other seafoods, -3.7 percent
• Oils and fats, -1.6 percent
• Fruits and nuts, 4.9 percent
• Milk, other dairy products and eggs, 3.5 percent
Lastly, Inflation for Rice decelerated to 3.4 percent from 6.2 percent last month while the deflation for Corn was observed at -16.0 percent (from -11.3 percent) this September 2024.
| Attachment | Size |
|---|---|
|
|
646.05 KB |