
Release-Date
Reference-Number
2024-112
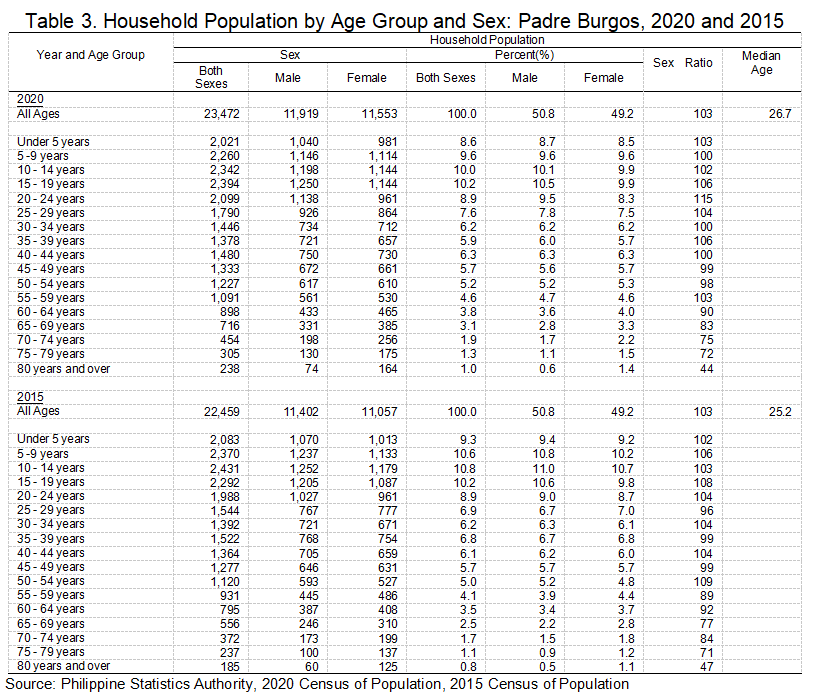
As of May 1, 2020, the household population of Padre Burgos was recorded at 23,472 individuals, based on the result of the 2020 Census of Population and Housing (2020 CPH).
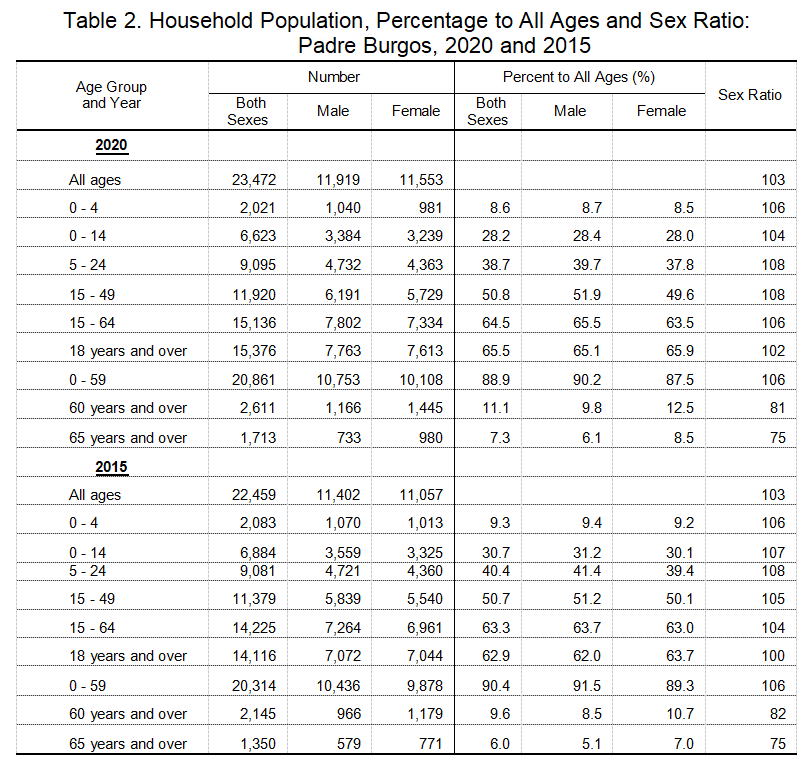
Of the total household population in 2020, 11,919 (50.8%) were males while 11,553 (49.2%) were females. By age group, 6,623 persons (28.2%) were under 15 years of age (young dependents), while persons aged 15 to 64 years (working-age or economically active population) totaled 15,136 (64.5%). Those in the age group 65 years and over (old dependents) comprised the remaining 1,713 persons (7.3%).
In 2015, persons aged 0 to 14 years, 15 to 64 years, and 65 years and above accounted for 30.7 percent, 63.3 percent, and 6.0 percent, respectively, of the total household population.
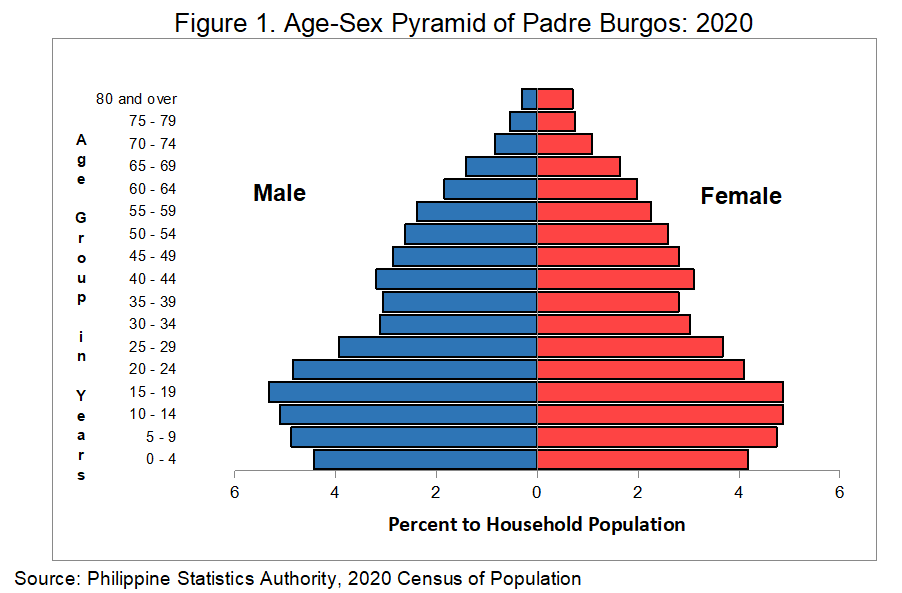
Moreover, there were more males (90.2%) than females (87.5%) among the 0 to 59 age group. Meanwhile, for older age group (60 years and over) females (12.5%) outnumbered the males (9.8%). The same trend was also observed in 2015.
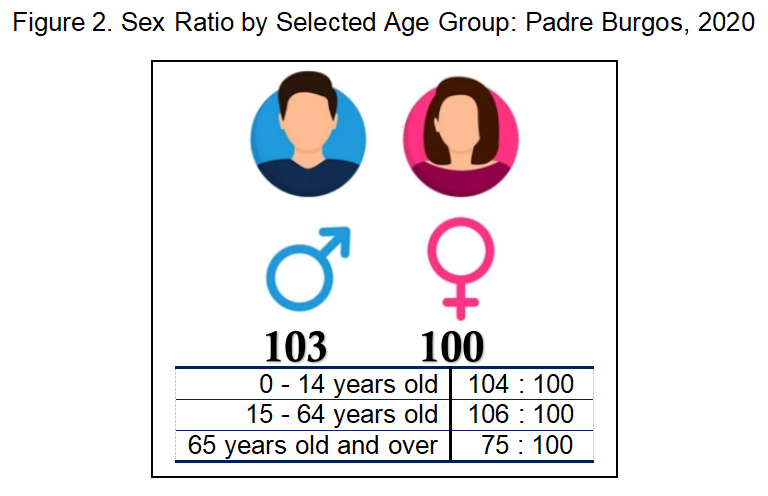
Sex ratio stands at 103 males per 100 females
The sex ratio in Padre Burgos was computed at 103 in 2020. This implies that there were 103 males for every 100 females. In 2015, the sex ratio was the same at 103 males for every 100 females.
In 2020, children aged below 15 years had a sex ratio of 104 males for every 100 females, while those aged 15 - 64 years old had a sex ratio of 106 males for every 100 females. On the other hand, those aged 65 years and over had a sex ratio of 75 males for every 100 females. This implies a higher mortality rate among males than females or a longer life expectancy among females than males in the older age groups.
Median age increases to 26.7 years
The median age in Padre Burgos was computed at 26.7 years, which means that half of the household population were younger than 26.7 years, while the other half were older than 26.7 years. The median age of 25.2 posted in 2015 was lower compared to 2020.
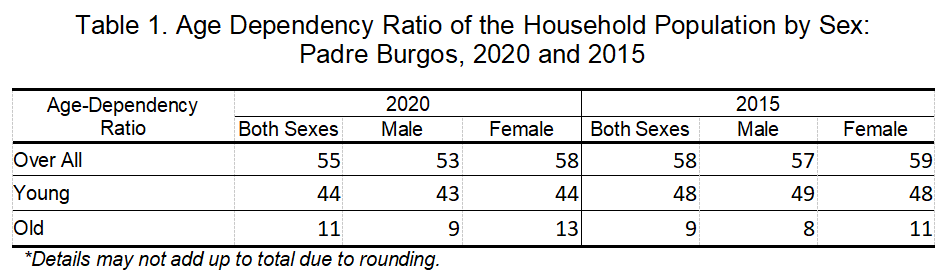
Dependency ratio declines to 55 dependents per 100 persons in the working age-group
The dependency ratio in Padre Burgos was computed at 55, which indicates that for every 100 working-age population, there were about 55 dependents (44 young dependents and 11 old dependents). This is lower than the dependency ratio in 2015 at 58 dependents (48 young dependents and 9 old dependents).
There are more males than females among children under five years old
Children below five years old comprised 8.6 percent (2,021) of the household population. The sex ratio was computed at 106 males for every 100 females.
About two in every five household population are of school age
The school-age population (5 to 24 years old) accounted for 9,095 persons (38.7%) of the 23,472 household population in Padre Burgos. This total is higher compared to the 9,081 (40.4%) school-age population that was reported in 2015.
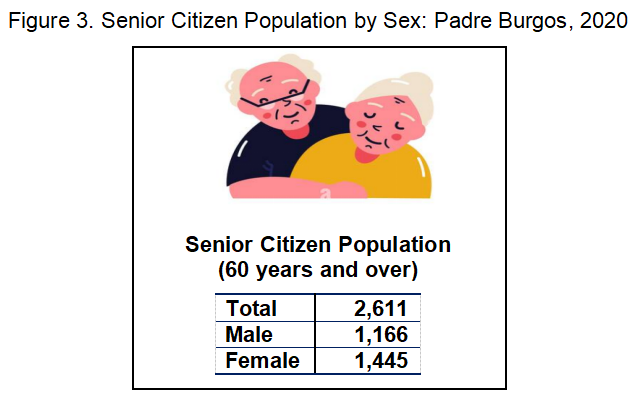
Senior citizens constitute 11.1 percent of the household population
People aged 60 years old and over are regarded as senior citizens in the Philippines. They made up 11.1 percent (2,611) of the household population in 2020. There were more females (1,445 or 55.3%) than males (1,166 or 44.7%) among the senior citizens. The same trend was observed in 2015 where females (1,179 or 55.0%) outnumbered their male counterpart (966 or 45.0%).
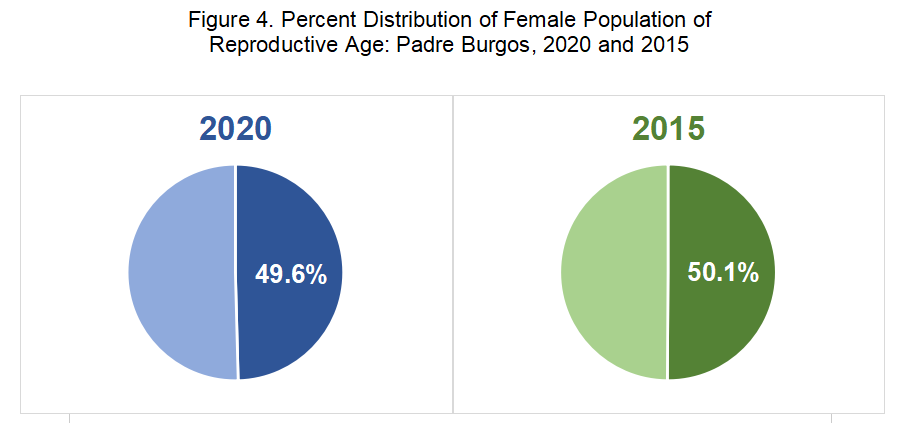
Less than half of the female population are of reproductive age
Women of reproductive age (15 - 49 years old) totaled 5,729 or 49.6 percent of the 11,553 female household population in 2020. In 2015, there were 5,540 females of reproductive age, comprising 50.1 percent of the female household population during the year.
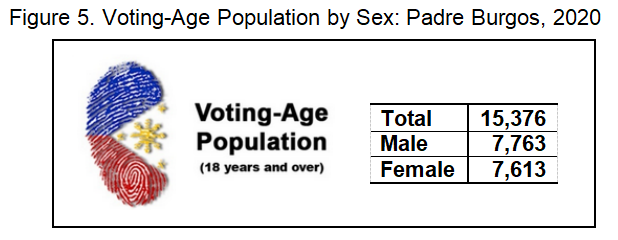
About 66.0 percent of the household population are of voting age
The voting-age population (18 years old and over) accounted for 65.5 percent (15,376) of the household population in 2020, up from 62.9 percent (14,116) in 2015.
(SGD.) AIRENE A. PUCYUTAN
Provincial Statistics Officer
AAP/NDP/MGC/IJCA/DOC
| Attachment | Size |
|---|---|
|
|
1.95 MB |