
Release-Date
Reference-Number
2025-02-040
A. Fisheries production declined by 6.9 percent in the fourth quarter of 2024
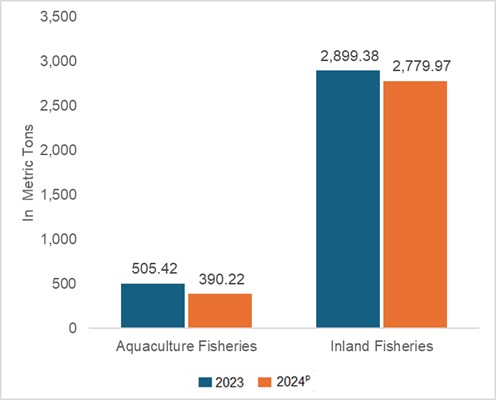
The total volume of fisheries production in the fourth quarter of 2024 was registered at 3,170.19 metric tons, a decrease of 6.9 percent from the 3,404.80 metric tons output in the same quarter of the previous year. The highest decline was attributed to the decrease in volume of production in aquaculture fisheries subsector equivalent to 22.8 percent. The inland fisheries subsector had the highest share of 87.7 percent to the total fisheries production during the quarter. (Figure 1 and Table 1)
Figure 1. Volume of Fisheries Production by Subsector:
Laguna, Fourth Quarter 2023 - 2024p
Aquaculture Fisheries
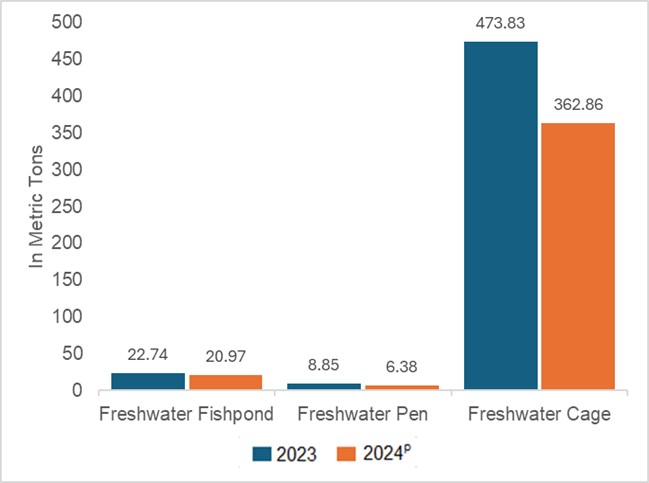
Aquaculture fisheries production was registered at 390.22 metric tons. This was lower by 22.8 percent from the previous year’s same period output of 505.42 metric tons. Freshwater fishpond production of 20.97 metric tons decreased by 7.8 percent compared to last year’s output of 22.74 metric tons. Freshwater pen has recorded 6.38 metric tons production indicating a decrease of 27.9 percent compared to the previous year’s same period output of 8.85 metric tons. Freshwater cage volume of production was estimated at 362.86 metric tons. This indicates a decline of 23.4 percent from the same quarter of the previous year’s level of 473.83 metric tons. The freshwater cage constituted the highest share of 93.0 percent to the total aquaculture production during the quarter. (Figure 2 and Table 2)
Figure 2. Volume of Aquaculture Fisheries Production (in Metric Tons) by Type of Environment:
Laguna, Fourth Quarter 2023 - 2024p
Inland Fisheries
During the quarter, inland fisheries production was recorded at 2,779.97 metric tons. This indicates a decrease of 4.1 percent from the 2,899.38 metric tons output in the same quarter from the previous year.
The species that contributed to the decrease in inland production were snail (suso, -4.8%), tilapia (-7.8%), and catfish (kanduli, -18.8%).
On the other hand, increases were noted in big head carp (91.0% and milkfish (bangus, 37.9%). (Table 3)
B. Fisheries production decreased by 7.9 percent in 2024
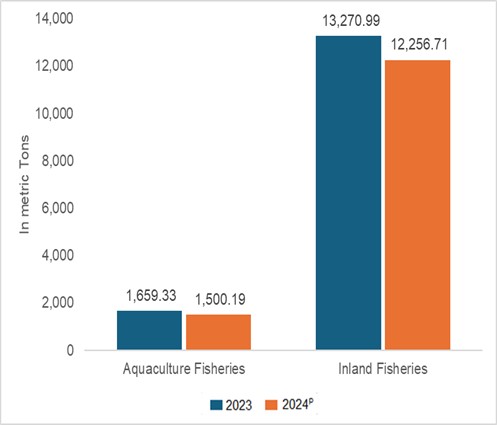
In 2024, the volume of fisheries production was recorded at 13.76 thousand metric tons. This indicates an annual average decrease of 7.9 percent from the 14.93 thousand metric tons output in 2023. Decreases in production were highly noted in aquaculture fisheries subsector with 9.6 percent. The percent share of inland fisheries and aquaculture fisheries were 89.1 percent and 10.9 percent, respectively. (Figure 3 and Table 4)
Figure 3. Volume of Fisheries Production by Subsector:
Laguna, January to December 2023 - 2024p
Aquaculture Fisheries
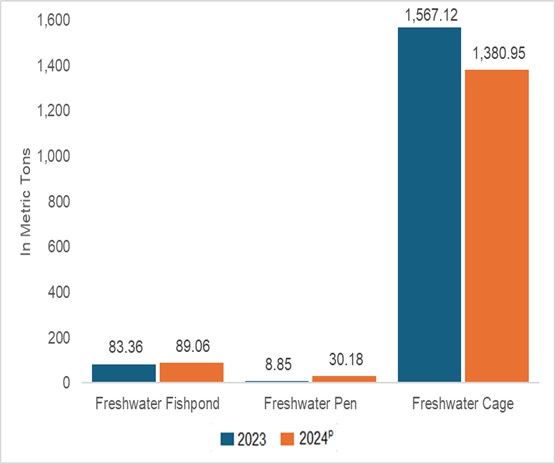
Aquaculture fisheries volume of production was estimated at 1.5 thousand metric tons during the year. This was 9.6 percent lower than the 2023 level of 1.7 thousand metric tons. Increases in production were noted in freshwater fishpond and freshwater pen. Only freshwater cage displayed downtrend in production. (Figure 4 and Table 5)
Figure 4. Volume of Aquaculture Fisheries Production (in Metric Tons) by Type of Environment:
Laguna, January to December 2023-2024p
Inland Fisheries
The annual inland volume of production was estimated at 12.3 thousand metric tons in 2024. This shows an annual average decrease of 7.6 percent compared to the previous year’s output of 13.3 thousand metric tons.
Of the species, output reductions were primarily noted in tilapia (5.9%) and snail (suso, 10.7%).
On the other hand, output improvements were mainly reported in big head carp (37.0%), milkfish (bangus, 52.6%), starry goby (dulong, 90.6%), and freshwater goby (biya, 168.0%). (Table 6)
MAGDALENA T. SERQUEÑA
Provincial Statistics Officer
| Attachment | Size |
|---|---|
|
|
2.09 MB |
|
|
29.87 KB |
Reference Period
2024