
Release-Date
Reference-Number
2025-026
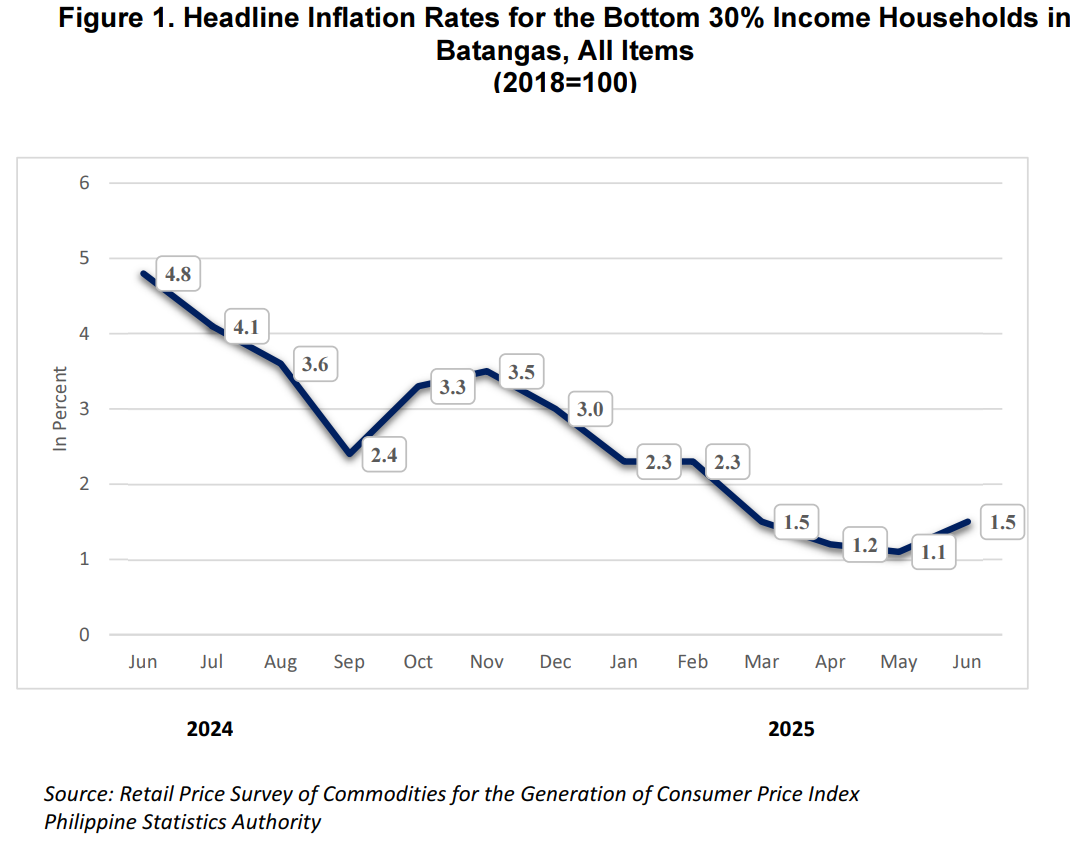
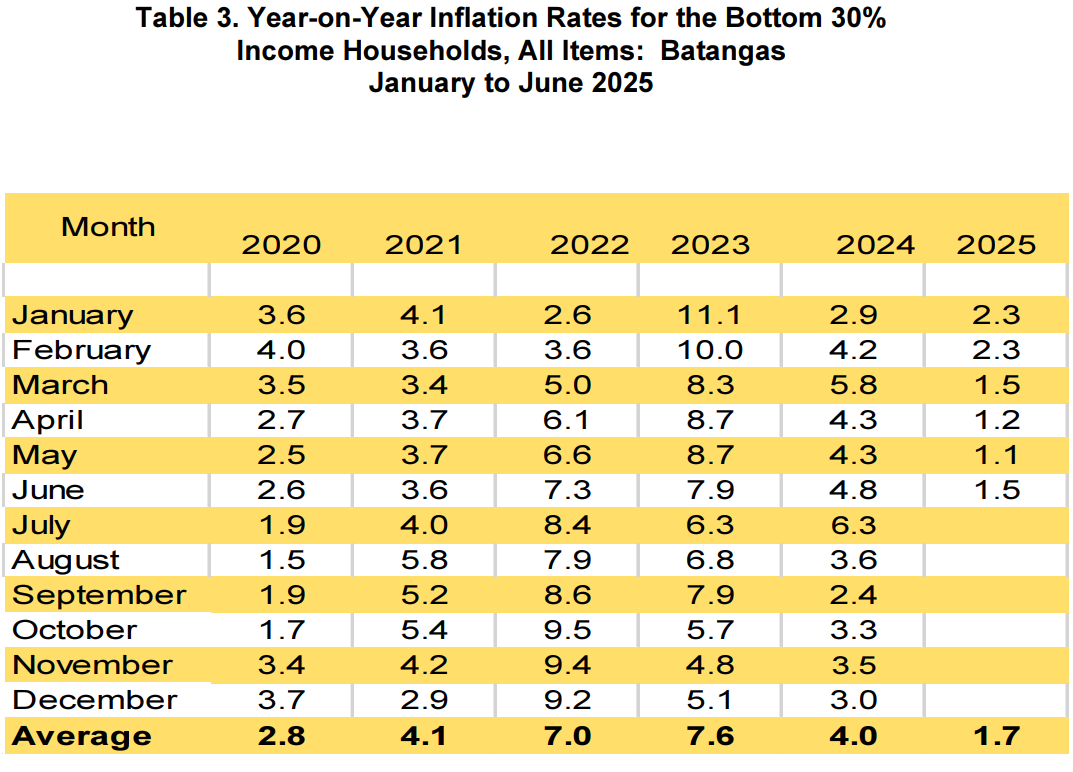
The Batangas Province inflation rate for the bottom 30% income households accelerated further to 1.5 percent in June 2025, from 1.1 in May 2025. This brings the average inflation rate for this income group from January to June 2025 to 1.7 percent. In comparison, the inflation rate in June 2024 was recorded at 4.8 percent (Figure 1).
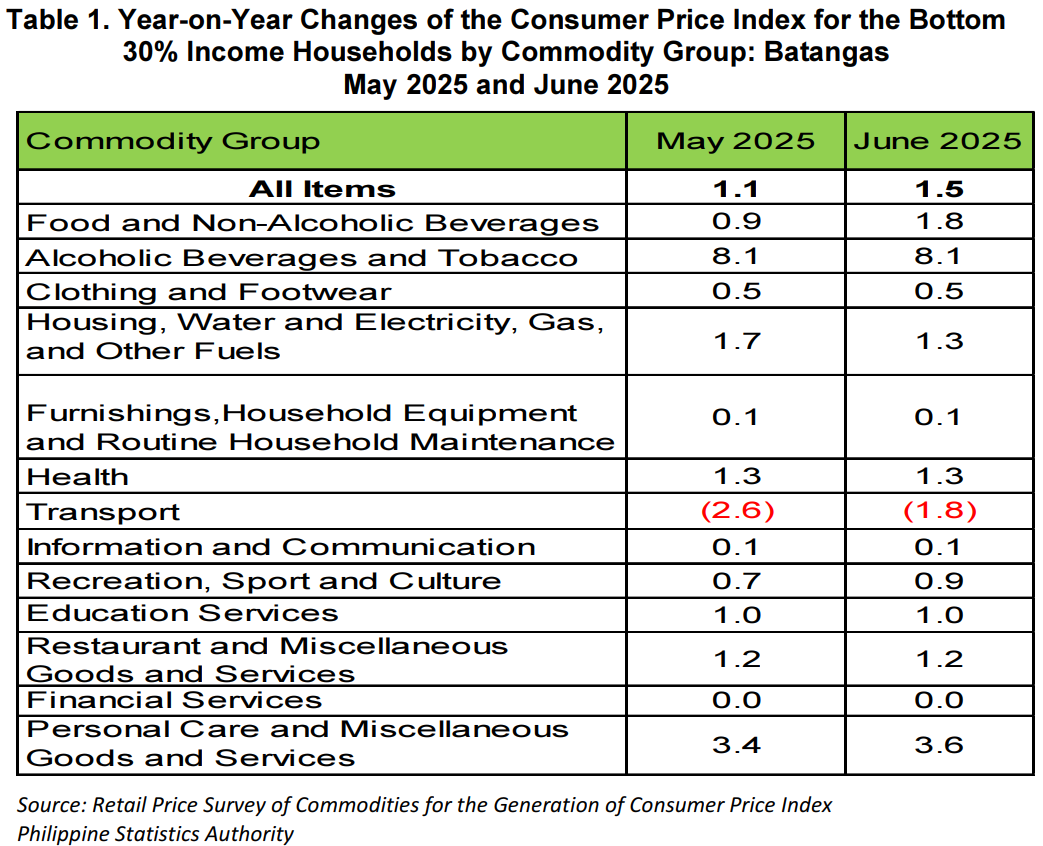
The uptrend in the overall inflation for the bottom 30% income households in June 2025 was primarily driven by the annual increase in the index of the food and non-alcoholic beverages, which rose to 1.8 from 0.9 percent in May 2025. Transport also contributed to the higher inflation rate, as its index posted a slower annual decline of -1.8 percent in June 2025 compared to -2.6 percent in the previous month.
In addition, higher annual growth rates were noted in the indices of the following commodity groups in June 2025:
a. Personal care, and miscellaneous goods and services, 3.6 percent from 3.4 percent;
b. Recreation, sports and culture, 0.9 percent from 0.7 percent.
In contrast, lower annual growth rate was recorded in the index of housing, water, electricity, gas and other fuel gas, which declined to 1.3 percent from 1.7 percent
The indices of the remaining commodity groups maintained their respective annual growth rates from the previous month. (Table 1)
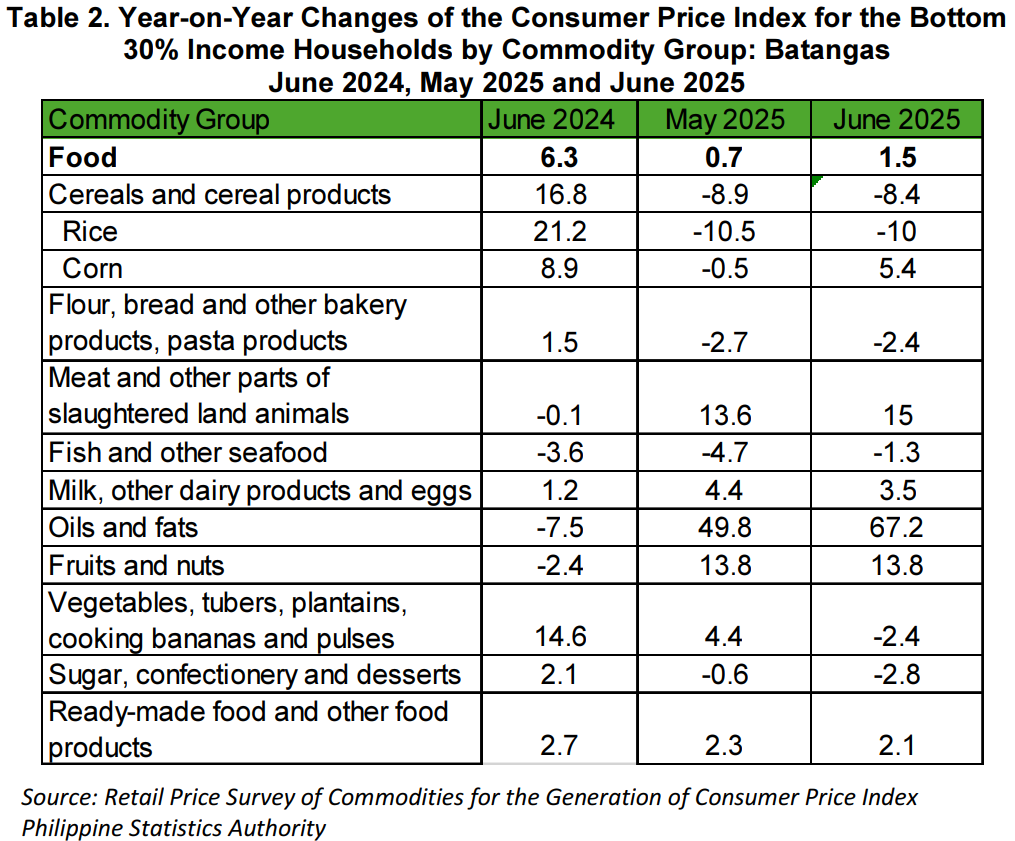
Food inflation for the bottom 30% income households in Batangas recorded an annual increase of 1.5 percent in June 2025, up from 0.7 percent in the previous month. In June 2024, food inflation was recorded at 6.3 percent.
The rise of food inflation in June 2025 was primarily driven by the faster year-on-year increases in the following food groups:
a. Meat and other parts of slaughtered land animals, 15.0 percent from 13.6 percent;
b. Oils and Fats, 67.2 percent from 49.8 percent;
Fish and other seafood, -1.3 percent from -4.7 percent;
d. Cereals and cereal products, -8.4 percent from -8.9 percent.
On the contrary, faster year-on-year decreases were observed in the indices of:
Milk, other dairy products and eggs, 3.5 percent from 4.4 percent
Ready-made food and other food products, 2.1 percent from 2.3 percent
Sugar, confectionery and desserts, -2.8 percent from -0.6 percent
d. Vegetables, tubers. Plantains, cooking bananas and pulses, -2.4 percent from 4.4 percent
In addition, the corn inflation rate rose further to 5.4 percent in June 2025 from -0.5 percent in the previous month. Meanwhile, the inflation rate for fruits and nuts remained unchanged at 13.8 percent.
The top three food groups in terms of contribution to food inflation during the month were as follows:
a. Meat and other parts of slaughtered land animals with a 187.9 percent share or 2.82 percentage points
b. Oils and fats with a 112.1 percent share or 1.68 percentage points; and
c. Fruits and nuts with a 23.6 percent share or 0.35 percentage points.

| Attachment | Size |
|---|---|
|
|
265.13 KB |