
Release-Date
Reference-Number
2024-006
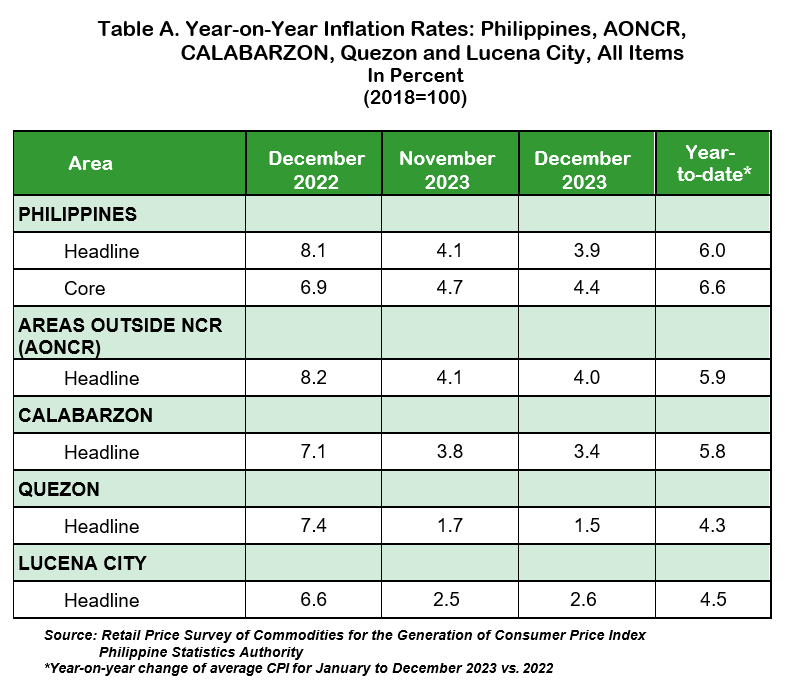
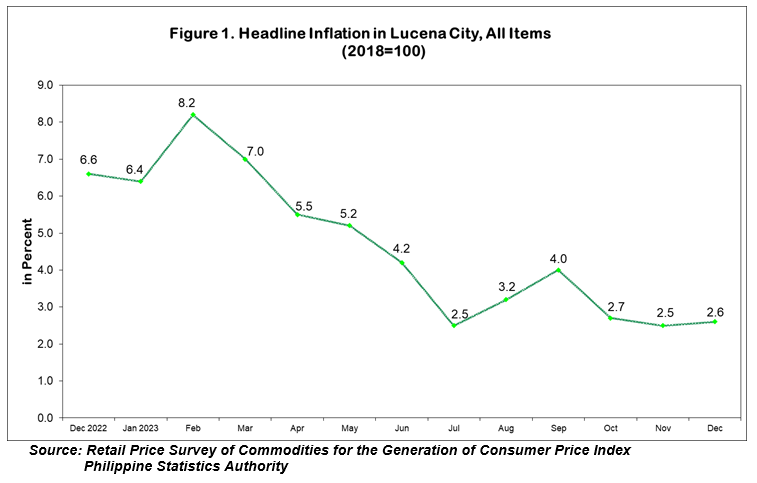
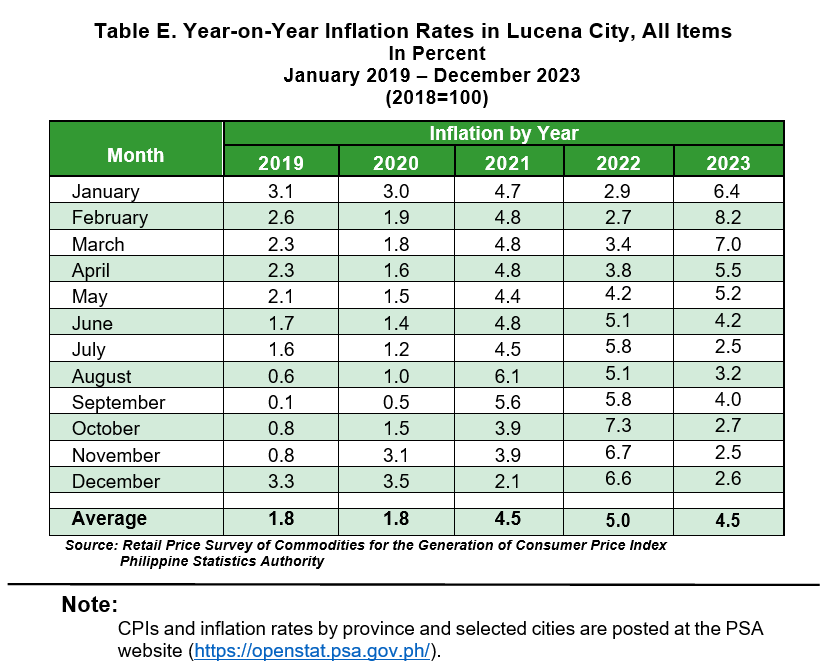
The headline inflation in Lucena City increased to 2.6 percent in December 2023, from 2.5 percent in November 2023. The inflation in December 2023 was lower compared to December 2022 inflation which was recorded at 6.6 percent.
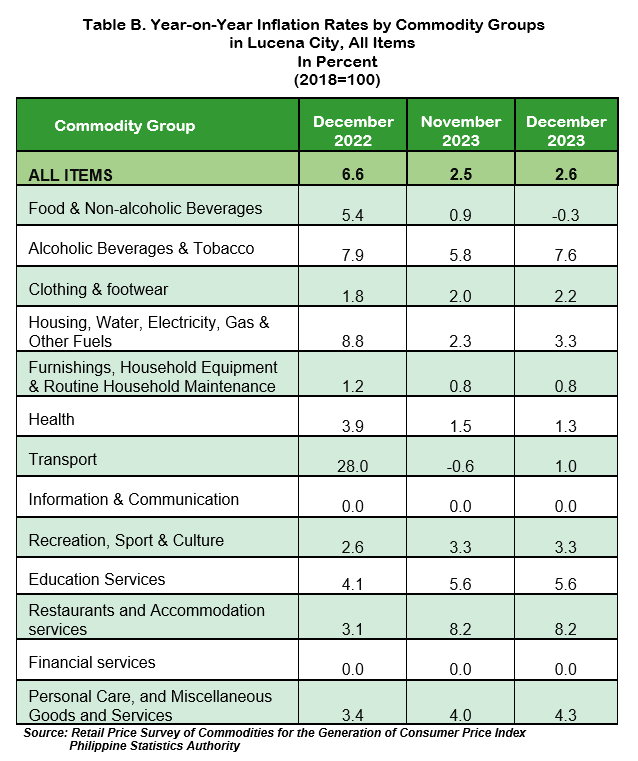
The acceleration in the inflation rate of Lucena City in December 2023 was primarily due to the higher annual increment recorded in the index for housing, water, electricity, gas and other fuels at 3.3 percent, from 2.3 percent in the previous month. This was followed by transport, whose index increased to 1.0 percent year-on-year during the month, from 0.6 percent annual decrement in November 2023. Also contributing to the uptrend in the overall inflation during the period were the higher annual increments in the indices of the following commodity groups as compared with their previous month’s inflation rates:
a. Alcoholic beverages and tobacco at 7.6 percent, from 5.8 percent;
b. Clothing and footwear at 2.2 percent, from 2.0 percent; and
c. Personal care, and miscellaneous goods and services at 4.3 percent, from 4.0 percent.
ln contrast, among the 13 commodity groups, the following commodity groups registered lower inflation rates during the month:
a. Food and non-alcoholic beverages at -0.3 percent, from 0.9 percent; and
b. Health at 1.3 percent, from 1.5 percent.
Meanwhile, the following commodity groups retained their previous month’s inflation:
a. Furnishings, household equipment and routine household maintenance at 0.8 percent;
b. Information and communication at 0.0 percent;
c. Recreation, sport and culture at 3.3 percent;
d. Education services at 5.6 percent;
e. Restaurants and accommodation services at 8.2 percent; and
f. Financial services at 0.0 percent.
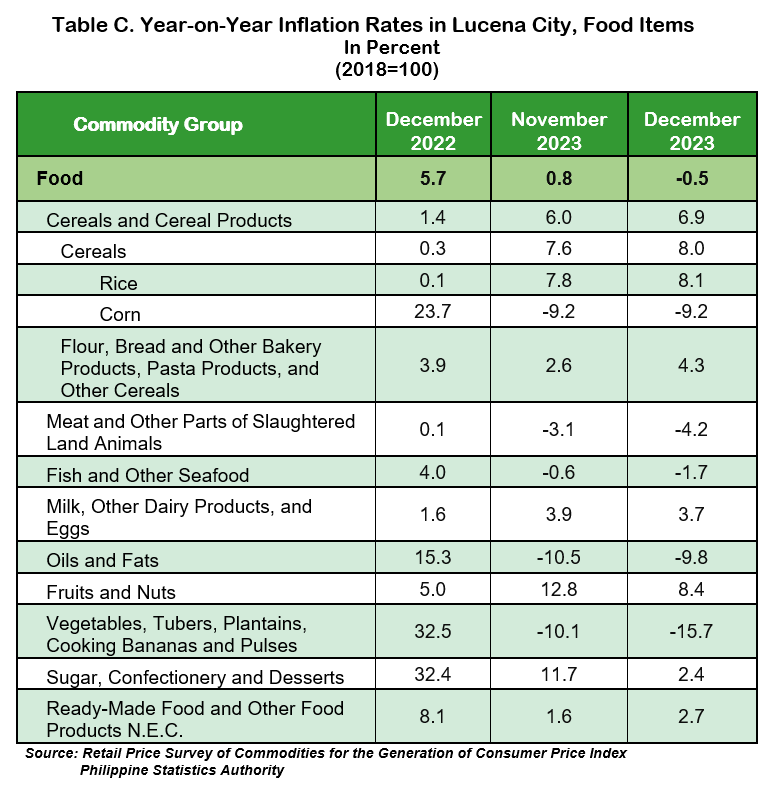
Inflation for food in Lucena City recorded a 0.5 percent annual decline during the month. It decreased from 0.8 percent in November 2023. In December 2022, food inflation was higher at 5.7 percent.
The deceleration in food inflation in December 2023 was primarily brought about by faster year-on-year decrease in vegetables, tubers, plantains, cooking bananas and pulses at 15.7 percent during the month, from 10.1 percent decline in November 2023. Sugar, confectionery and desserts also contributed to the downtrend with a slower inflation rate of 2.4 percent in December 2023, from 11.7 percent in November 2023.
Likewise, lower growth rates of the following food groups were recorded:
a. Meat and other parts of slaughtered land animals at -4.2 percent, from -3.1 percent;
b. Fish and other seafood at -1.7 percent, from -0.6 percent;
c. Milk, other dairy products and eggs at 3.7 percent, from 3.9 percent; and
d. Fruits and nuts at 8.4 percent, from 12.8 percent.
In contrast, the following food groups posted higher inflation rates during the month:
a. Rice at 8.1 percent, from 7.8 percent;
b. Flour, bread and other bakery products, pasta products, and other cereals at 4.3 percent, from 2.6 percent;
c. Oils and fats at -9.8 percent, from -10.5 percent; and
d. Ready-made food and other food products not elsewhere classified at 2.7 percent, from 1.6 percent.
Meanwhile, corn retained its previous month’s inflation of -9.2 percent.
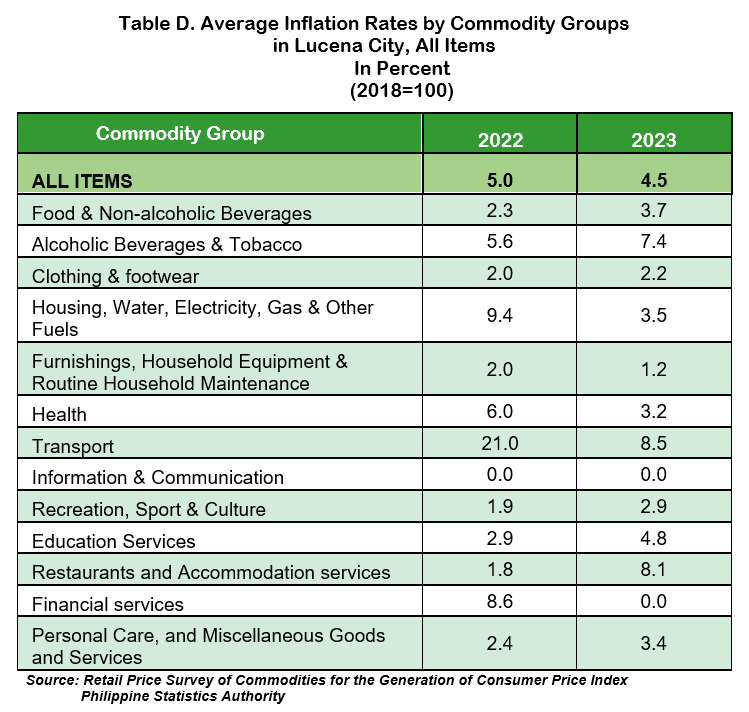
The average inflation rate in the province for 2023 stood at 4.5 percent, lower than the 2022 average inflation rate of 5.0 percent.
Compared with their respective average inflation rates in 2022, the indices of the following commodity groups recorded lower annual mark-ups in 2023:
a. Housing, water, electricity, gas and other fuels at 3.5 percent, from 9.4 percent;
b. Furnishings, household equipment and routine household maintenance at 1.2 percent, from 2.0 percent;
c. Health at 3.2 percent, from 6.0 percent;
d. Transport at 8.5 percent, from 21.0 percent; and
e. Financial services at 0.0 percent, from 8.6 percent.
In contrast, average inflation during the year was higher in the indices of the following commodity groups compared to that of the previous year:
a. Food and non-alcoholic beverages at 3.7 percent, from 2.3 percent;
b. Alcoholic beverages and tobacco at 7.4 percent, from 5.6 percent;
c. Clothing and footwear at 2.2 percent, from 2.0 percent;
d. Recreation, sport and culture at 2.9 percent, from 1.9 percent;
e. Education services at 4.8 percent, from 2.9 percent;
f. Restaurants and accommodation services at 8.1 percent, from 1.8 percent; and
g. Personal care, and miscellaneous goods and services at 3.4 percent, from 2.4 percent.
Meanwhile, only information and communication retained its 2022 average inflation rate of 0.0 percent.
(SGD.) AIRENE A. PUCYUTAN
Provincial Statistics Officer
PSA Quezon
NDP/IJCA/EAD
| Attachment | Size |
|---|---|
|
|
2.69 MB |