
Release-Date
Reference-Number
2024-040
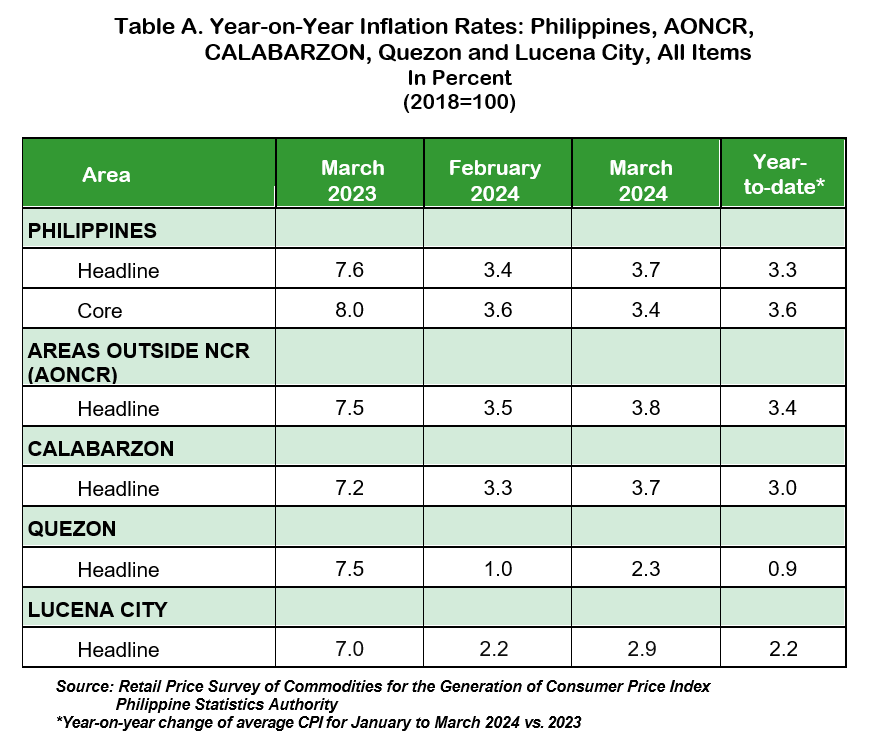
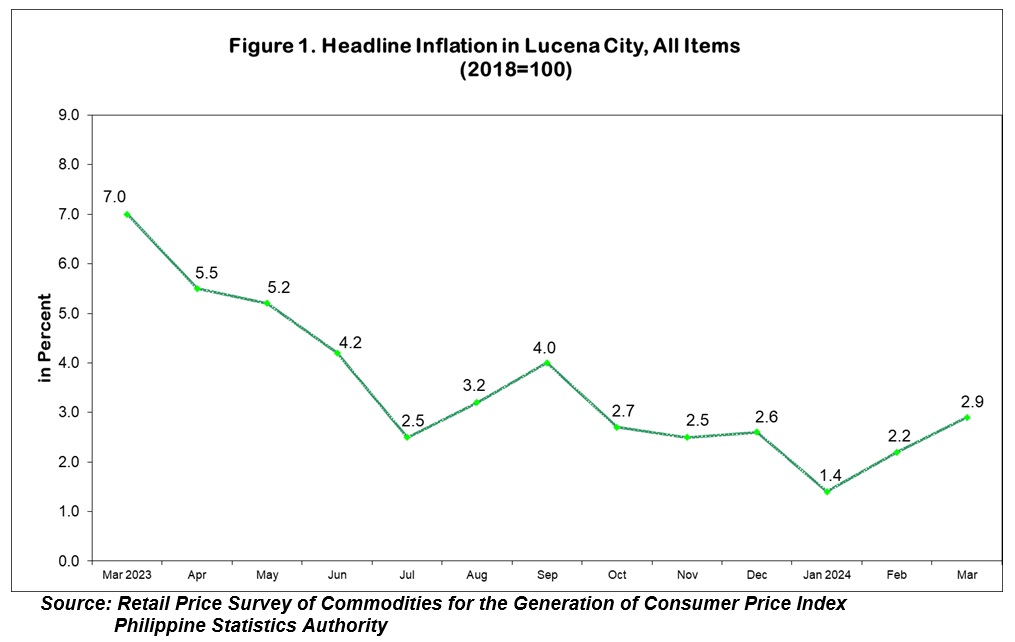
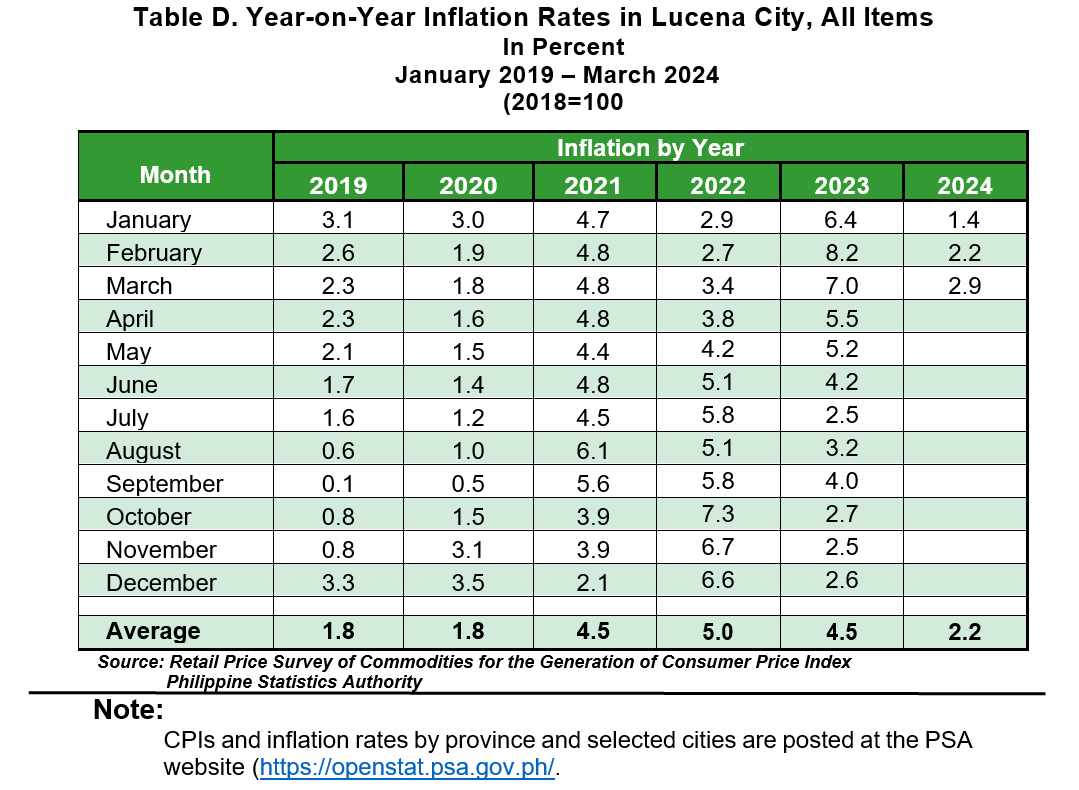
The headline inflation or overall inflation in Lucena City continued its uptrend as it moved up further to 2.9 percent in March 2024, from 2.2 percent in February 2024. This brings the city’s average inflation from January 2024 to March 2024 at 2.2 percent. In March 2023, inflation rate was higher at 7.0 percent.
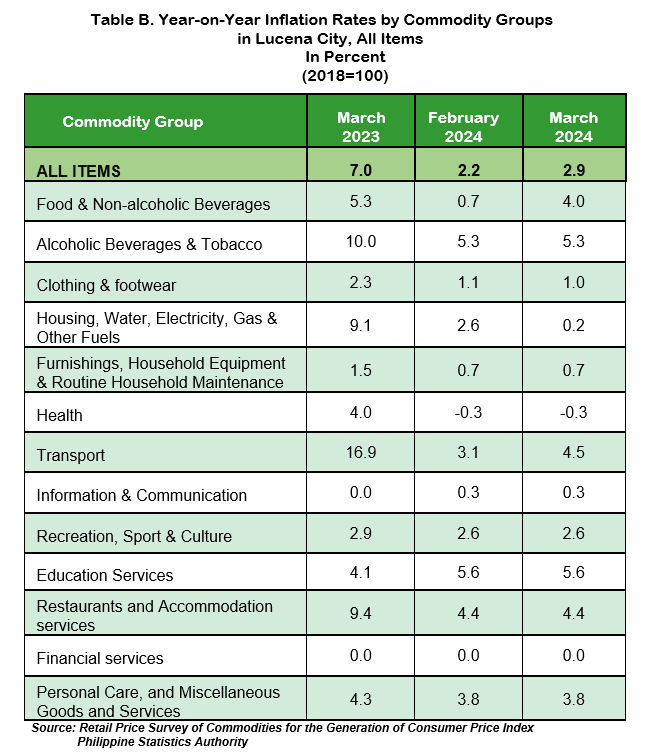
The acceleration in the inflation rate of Lucena City was primarily influenced by the higher annual increase of the heavily-weighted food and non-alcoholic beverages at 4.0 percent during the month, from 0.7 percent in February 2024. The higher year-on-year increase in transport at 4.5 percent in March 2024, from 3.1 percent in the previous month also contributed to the uptrend.
In contrast, the following commodity groups registered lower inflation rates during the month:
a. Clothing and footwear at 1.0 percent; from 1.1 percent; and
b. Housing, water, electricity, gas and other fuels at 0.2 percent, from 2.6 percent.
Meanwhile, the following commodity groups retained their previous month’s inflation:
a. Alcoholic beverages and tobacco at 5.3 percent;
b. Furnishings, household equipment and routine household maintenance at 0.7 percent;
c. Health at -0.3 percent;
d. Information and communication at 0.3 percent;
e. Recreation, sport and culture at 2.6 percent;
f. Education services at 5.6 percent;
g. Restaurants and accommodation services at 4.4 percent;
h. Financial services at 0.0 percent; and
i. Personal care, and miscellaneous goods and services at 3.8 percent.
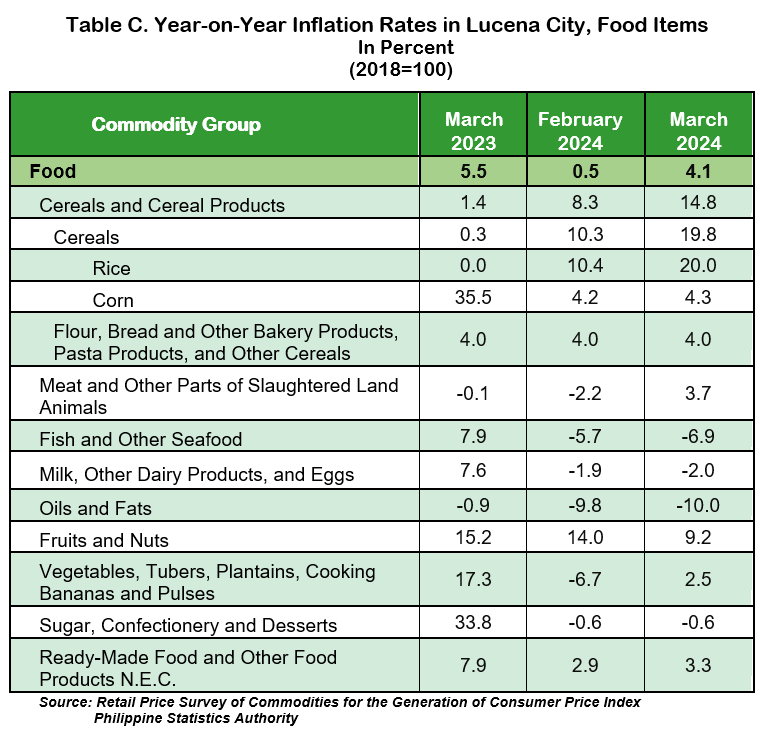
Food inflation in Lucena City further increased to 4.1 percent in March 2024, from 0.5 percent in February 2024. In March 2023, food inflation was higher at 5.5 percent.
The uptrend in the food inflation in March 2024 was primarily brought about by the higher annual increment in the rice index at 20.0 percent during the month, from 10.4 percent in February 2024. Annual increase in the index of meat and other parts of slaughtered land animals at 3.7 percent in March 2024, from an annual decline of 2.2 percent in the previous month contributed to the uptrend.
In addition, other contributing factors in the increment of food inflation in the city were the higher inflation rates of the following food groups during the month:
a. Corn at 4.3 percent, from 4.2 percent;
b. Vegetables, tubers, plantains, cooking bananas and pulses at 2.5 percent, from -6.7 percent; and
c. Ready-made food and other food products not elsewhere classified at 3.3 percent, from 2.9 percent.
In contrast, the inflation of the following food groups decreased during the month:
a. Fish and other seafood at -6.9 percent, from -5.7 percent;
b. Milk, other dairy products and eggs at -2.0 percent, from -1.9 percent;
c. Oils and fats at -10.0 percent, from -9.8 percent; and
d. Fruits and nuts at 9.2 percent, from 14.0 percent.
Meanwhile, the following food groups retained its previous month’s inflation:
a. Flour, bread and other bakery products, pasta products, and other cereals at 4.0 percent; and
b. Sugar, confectionery and desserts at -0.6 percent.
(SGD.) AIRENE A. PUCYUTAN
Provincial Statistics Officer
PSA Quezon
NDP/IJCA/EAD
| Attachment | Size |
|---|---|
|
|
2.05 MB |